53.jasper&ireport2012. 9. 25. 03:22
반응형
이 문서는 나는나 님의 블로그에 올려져 있는
iReport 개발자 매뉴얼.pdf
JasperReports_개발자_매뉴얼-rokmc7980304.pdf
를 보고 아주 많은 도움을 받았습니다.

아직도 위의 매뉴얼을 반도 해 보진 못했지만 간단한 웹보고서를 만들 수 있었습니다.
필요하신 분은 나는나님의 블로그에 방문하셔서 위의 PDF 파일을 다운받아서 공부하시면 보다 심도깊은 보고서를 만드실 수 있다고 생각합니다. 좋은 자료를 공개하신 나는나님에게 다시 한 번 감사의 말씀을 전합니다.

-----------------------------------------------------------------------------

사용된 것들

MS Windows 2000 Advanced
JDK5.0 Update 8
TOMCAT 5.5
PostgreSql 8.1.4
Struts 1.2.9
iReport 1.2.5
JasperReports 1.2.5

Adobe Reader 7.0
AcroEdit 0.9.5.30


이 글을 무리없이 보고 이해할 수 있는 레벨

이글은 제가 생각하기에

웹보고서를 만드는 가장 쉬운 방법을 적은 글입니다.

하지만, 쉽다고는 하지만 아래에 밝힌 실력만큼은 갖추고 있는 분에게만

쉽다는 얘기입니다.

본문에서는 각 분야의 기초적인 설명은 하지 않습니다.

기초설명하다가 본래의 목적을 벗어날까 해서 입니다.

- 우선 톰캣에 웹어플리케이션을 만들 줄 알고 간단하게나마 운용할 줄 알아야 합니다.

- 자바에 대한 공부가 어느정도 되어 있어야 합니다.

명령행에서 컴파일을 할 줄 알아야하고

간단한 소스는 눈으로 보고 어떻게 돌아가는 건지 파악할 줄 알아야 합니다.

- Struts에 대한 지식이 약간(?) 필요합니다.

- 데이타베이스를 다룰줄 알아야 합니다.

이 문서에서는 PostgreSql을 사용하는데 다른 RDBM도 상관없지만

데이타베이스를 만들고 테이블도 만들어서 프라이머리키를 지정할 수 있고

기본적인 SQL문을 작성해서 실행할 줄 알아야 합니다.

-----------------------------------------------------------------

자~~~ 그럼, 본론으로 들어갑니다.

이번엔, 최근에 조사하고 테스트한 웹보고서를 만드는 법에 대해 내용입니다.

거의 3주간 자료찾아보고 테스트하느라 제 PC를 몇 번씩 뒤집었다는...

의외로 자료가 부족해서 시간이 많이 걸렸습니다.

이 자료를 보고 저처럼 쓸데없이 시간을 버리는 것을

조금이나마 줄일 수 있었으면 합니다.

일반 C/S 프로그램에서는 각종 개발툴의 안에 보고서를 만들어 주는 기능이

들어 있거나 관련 라이브러리가 있어서 제작하기가 쉽지만

웹상에서 정형화된 보고서를 유저에게 제공하는 기능을 보기란 그리 흔치 않습니다.

이번에 알아본 것은 iReport라는 프로그램과

JasperAssistant라는 Eclipse 플러그인이었습니다.

이중에 JasperAssistant는 유료이고 Eclipse에서 사용하는 것이기도 하고

실제로 사용해 보니 iReport로도 웬만한 보고서는 만들어 낼 수 있었고

화면 운영방식이 Eclipse 안에서 움직이는 것이 틀릴 뿐이고 기본적인 것은

거의 같기 때문에 JasperAssistant에 대한 설명은 하지 않습니다.

이 문서를 충분히 이해하신 분은 무리없이 JasperAssistant도 다룰 수 있을 겁니다.

하지만 고급기능들까지 해 보질 않아서

둘사이의 장단점을 확실히 꼬집어 내진 못하겠습니다.

이 문서를 이해하면 할 수 있는 것

Java + Tomcat(Struts) + PostgreSql의 환경하에서
간단한 웹보고서를 자신의 웹어플리케이션에서 제공할 수 있게됩니다.

이 문서의 소프트웨어 환경

다음은 이 문서를 작성하면서 설치한 환경입니다.

실력이 있으신 분은 상관없지만

되도록 똑같은 환경에서 하셔야 에러를 최소한으로 줄이실 수

있을 것입니다.

자신의 환경을 감안하면서 적용해 보시기 바랍니다.

운영체제 : MS Windows 2000 Advanced

JDK5.0 (설치하기)
Tomcat 5.5 (설치하기)
PostgreSql 8.1.4 (설치하기)

Test용 Tomcat 웹어플리케이션 MyWeb02 (설치하기)

Adobe Reader 설치<-- 알아서 설치하시길...
꼭! 사전에 설치해 둬야 합니다.
되도록 한국어 버전으로....

위의 소프트웨어들은 제 블로그를 보시면

다운로드 -> 설치 하는 법을 아실 수 있습니다.

(뭐,, 당연히 각자 하셔도 됩니다. 설치시 특별히 어려운 점은 없으니까요)

Struts 다운로드 및 설치

다운로드 URL : http://struts.apache.org/downloads.html
다운로드 파일명 : struts-1.2.9-bin.zip(13.8MB)

설치 : 우선 적당한 곳에 압축을 풀어놓습니다.
압축을 푼 폴더의 밑에 webapps 라는 폴더가 있는데
그 안의 struts-blank.war를 톰캣밑의 webapps에 복사해
넣습니다.
그러면 struts-blank 라는 웹어플리케이션이 자동으로 생깁니다.
스트러츠 사용할 줄 아시는 분은 다 아시는 내용이라고 생각하기 때문에
자세한 설명은 하지 않겠습니다.

* 나중에 이 안의 lib 안의 파일들을 웹어플리케이션에 그대로
복사해 넣을 것입니다.

JasperReports의 다운로드와 설치

JasperReports H.P URL : http://jasperforge.org/sf/projects/jasperreports
JasperReports 다운로드 :
http://sourceforge.net/project/showfiles.php?group_id=36382&package_id=28579

다운로드 파일명 : jasperreports-1.2.5.jar(1.33MB)
jasperreports-1.2.5-applet.jar(196KB)
jasperreports-1.2.5-project.tar.gz(24.1MB)
; (이 파일은 이 문서에서는 사용하지 않음)
jasperreports-1.2.5-project.zip(28.3MB)


JasperReports 설치 : 특별히 설치할 작업은 없습니다.
단지, 미리 jasperreports-1.2.5-project.zip 의 압축을
풀어놓으면 편할지도 모릅니다.(애매하군...)
* 이것도 나중에 이 안의 lib 폴더 안의 파일들을 웹어플리케이션에
전부 복사해 넣을 것입니다.

iReport의 다운로드

다운로드 URL : http://sourceforge.net/project/showfiles.php?group_id=64348
다운로드 파일명 : iReport-1.2.5-windows-installer.exe(30.3MB)

iReport의 설치

다운로드 받은 iReport-1.2.5-windows-installer.exe 을 더블클릭

설치시 어려운점은 없습니다. 그냥 Next 버튼을 몇 번 눌러주면 설치 끝.

설치 위치는 설치시 특별히 바꾸지 않는한

C:/Program Files/JasperSoft/iReport-1.2.5 에 설치 됩니다.


iReport로 템플레이트 파일 만들기
- 우선 설치한 iReport를 실행합니다.
설치시 경로를 바꾸지 않았다면
C:/Program Files/JasperSoft/iReport-1.2.5
에 설치되었을텐데
저의 경우에는 iReport.exe 를 실행하지 않고
iReport.bat 를 실행합니다.
왠지 이 배치파일로 실행해야 제대로 환경을 끌여들여서 실행하는 것 같습니다.

- iReport 화면이 떳으면 제일 처음에 JDBC 파일을 연결시켜 줍니다.
여기서는 PostgreSql 8.1.4를 설치했으므로
PostgreSql 8.1.4의 설치폴더 밑에 JDBC 폴더 안에
JDBC 드라이버가 설치되어 있는 것을 사용합니다.

메뉴에서 Options->Classpath 를 선택하면 윈도우가 하나 뜨는데
그 윈도우의 오른쪽에 있는 Add JAR 버튼을 누릅니다.
C:Program FilesPostgreSQL8.1jdbc 안의 postgresql-8.1-405.jdbc3.jar
를 선택합니다.
Save classp... 라는 버튼을 눌러 저장하고 나옵니다.

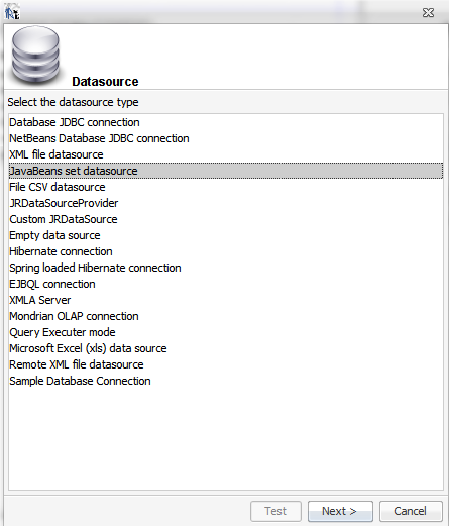
- 다음은 사용할 데이타소스를 정의해 줍니다.
메뉴에서 Data->Connections / Datasources 를 선택합니다.
화면 오른쪽의 New 버튼을 선택합니다.
아래 그림처럼 입력합니다.(각자의 환경에 맞추면 됩니다.)
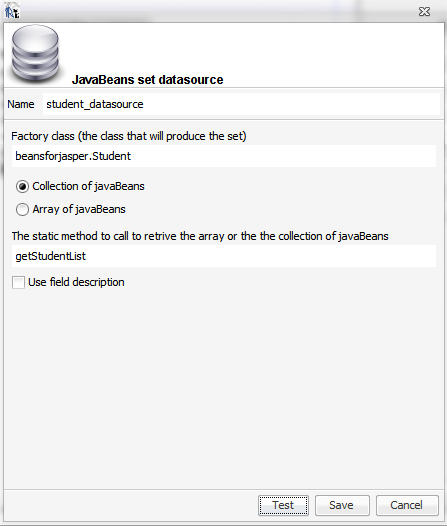


이 문서에서는
Username 에는 postgres
Password에는 postgres를 넣었습니다.
그 옆에 Save password는 체크해 주는 것이 나중을 위해 편합니다.
( 안 그러면 새로 실행할 때마다 패스워드 넣으라고 시끄럽게 떠듭니다. )
Test 버튼을 눌러 제대로 연결이 되는지 확인합니다.
연결이 안되면 물론 안됩니다.
당연한 얘기겠지만 데이타베이스명, 드라이버명,유저명,패스워드등을 잘 체크합니다.
연결이 잘 되면 Save버튼으로 저장하고 나옵니다.
- 여기서 데이타베이스의 데이타를 정리하고 갑시다.
현재 이 문서에서 사용하고 있는 데이타베이스는 PostgreSql이므로 그것을 위주로
설명을 하겠지만 다른 데이타베이스도 별 문제없이 사용될 것입니다.
데이타베이스에 대한 설명은 위에서도 밝혔듯이 하지 않습니다.
어느 정도 데이타베이스를 다룰줄 알아야 이 밑의 데이타 준비를 할 수 있을 것입니다.
데이타베이스 생성
CREATE DATABASE "MyDB01"
WITH OWNER = postgres
ENCODING = 'EUC_KR'
TABLESPACE = pg_default;
테이블생성
: rel 이라는 테이블을 생성합니다.
이것은 인맥구분에 사용할 테이블입니다.
다음은 생성 SQL입니다.
CREATE TABLE rel
(
rel_id int2 NOT NULL,
rel_name text,
CONSTRAINT "rel_PK" PRIMARY KEY (rel_id)
)
: tbl01 이라는 테이블을 생성합니다.
이것은 인맥정보로서 사용할 테이블입니다.
다음은 생성 SQL입니다.
CREATE TABLE tbl01
(
uid int4 NOT NULL,
fname text,
telno1 text,
rel_id int2,
CONSTRAINT "tbl01_PK" PRIMARY KEY (uid)
)
다음은 위의 테이블에 넣을 데이타를 SQL문으로 만든 것입니다.
insert into rel(rel_id, rel_name) values(1,'가족');
insert into rel(rel_id, rel_name) values(2,'친척');
insert into rel(rel_id, rel_name) values(3,'친구');
insert into rel(rel_id, rel_name) values(4,'선배');
insert into rel(rel_id, rel_name) values(5,'후배');
insert into tbl01(uid,fname,telno1,rel_id) values(1,'아버지','011-111-1111',1);
insert into tbl01(uid,fname,telno1,rel_id) values(2,'어머니','022-222-2222',1);
insert into tbl01(uid,fname,telno1,rel_id) values(3,'큰형','033-333-3333',1);
insert into tbl01(uid,fname,telno1,rel_id) values(4,'막내','044-444-4444',1);
insert into tbl01(uid,fname,telno1,rel_id) values(5,'삼촌','055-555-5555',2);
insert into tbl01(uid,fname,telno1,rel_id) values(6,'매형','066-666-6666',2);
insert into tbl01(uid,fname,telno1,rel_id) values(7,'덕팔이','077-777-7777',3);
insert into tbl01(uid,fname,telno1,rel_id) values(8,'용팔이','088-888-8888',3);
insert into tbl01(uid,fname,telno1,rel_id) values(9,'삼순이','099-999-9999',3);
insert into tbl01(uid,fname,telno1,rel_id) values(10,'최선배','100-100-1000',4);
insert into tbl01(uid,fname,telno1,rel_id) values(11,'김선배','200-200-2000',4);
insert into tbl01(uid,fname,telno1,rel_id) values(12,'이선배','300-300-3000',4);
insert into tbl01(uid,fname,telno1,rel_id) values(13,'송혜교','123-123-1234',5);
insert into tbl01(uid,fname,telno1,rel_id) values(14,'오연수','234-234-2345',5);
insert into tbl01(uid,fname,telno1,rel_id) values(15,'김희선','345-345-3456',5);
이 SQL을 실행시켜 기본 데이타를 준비하십시오.
(각자, 준비해도 됩니다.)
- 데이타까지 준비가 됐으니 보고서를 만들 SQL을 만듭니다.
이 문서에서는 이렇게 만들었습니다.
SELECT b.rel_name, a.fname, a.telno1
FROM tbl01 a LEFT JOIN rel b ON a.rel_id = b.rel_id
ORDER BY b.rel_name
- 이제 보고서를 만들 준비가 끝났습니다.
보고서를 만듭시다.(자신의 화면과 이 문서를 맞추어서 보시길...)
우선 iReport의 기능중에 Report Wizard 라는 편리한 기능이 있는데
이것을 이용하면 간단한 보고서 양식은 금방 만들 수 있습니다.
- 메뉴에서 File->Report Wizard 선택
- Step 1 : insert the query to retrieve report fields
Connection / Datasource 에 위에서 만든 데이타소스명을 선택합니다.
여기서는 MyDB01
밑에 SQL Query에 위에서 준비한 SQL 문장을 넣습니다.
SELECT b.rel_name, a.fname, a.telno1
FROM tbl01 a LEFT JOIN rel b ON a.rel_id = b.rel_id
ORDER BY b.rel_name


- Next 버튼을 누르면 "SmartCard PIN"이라는 윈도우가 나와서 Password를
넣으라고 나오는 사람은 데이타베이스 접속 패스워드를 넣어주면 됩니다.
위에서 데이타소스 정의시 Save password에 체크를 해 둔 사람은 이 윈도우는
나타나지 않습니다.
- Step 2 : select fields 화면에서 모든 컬럼명을 오른쪽으로 선택해서 넣습니다.
모든 컬럼을 선택하는 것은 단순히 ">>" 버튼을 누르면 됩니다.
Next 버튼 클릭
- Step 3 : Group by 윈도우는 그냥 두고 Next 버튼 클릭
- Step 4 : choose layout
Tabular layout을 선택
classicT.xml 선택
Next 버튼 선택
- Step 5 : finish
Finish 버튼 클릭
여기까지 왔으면 보고서 하나가 거의 완성이 되었습니다.
우선 저장을 합니다.
(알기쉬운 곳에 저장하는게 좋겠죠?
괜히 아주 잘 보관하겠다고 했다가
나중에 어디다 저장했는지 까먹는 황당한 수가 생깁니다.)
이 문서의 경우에는 D:/TEST/report01.jrxml라는 이름으로 저장했습니다.
다음은, 컴파일
메뉴->Build->Compile 를 선택하면 컴파일 됩니다.
메뉴바에 이쁘장한 아이콘들도 준비되어 있는데 컴파일 아이콘을 찾아서 해도 됩니다.
오른쪽 끄트머리쯤에 있습니다.
( 이 컴파일에서 나오는 에러메세지 같은 것들은 각자 알아서 해결하시길...
이 부분은 저도 설명할만한 수준이 아니라서리..)
다음은 출력될 보고서를 미리 봅니다.
메뉴->Build->JRViewer preview 선택
메뉴->Build->Execut(with active connection)을 선택
잘 보이나요?
잘 보여야 합니다.
안 보이면? 당연히 앞으로 돌아가서 다시 체크해 봐야겠죠?
다음은 PDF 형식으로 보죠.
메뉴->Build->PDF preview 선택
메뉴->Build->Execut(with active connection)을 선택
잘 보이나요?
잘 안보일겁니다.
미리 설명하려다가 위에서 잊어먹었습니다.
PDF로 보려면 iReport에 PDF는 뭘로 보겠다고 정해줘야 합니다.
이 문서에서는 Adobe Reader로 PDF를 볼 것입니다.
그래서 문두의 테스트 환경에 Adobe Reader 설치라고 친절히(?) 적어 놓았던 거죠.
메뉴->Options->Settings 선택
External programs 탭 선택
PDF Viewer에 Adobe Viewer 프로그램 선택
(이 문서에서는 C:/Program Files/AdobeAcrobat 7.0/Reader/AcroRd32.exe )
Save 버튼을 선택해서 저장하고 나옵니다.
다시 위의 PDF 로 보는 걸 해보죠.
잘 보이나요?
이번엔 보입니다.
보이긴 보이는데 뭔가 이상하죠?
한글 항목이 나타나질 않습니다.
그럼 제대로 보이는겁니다.
장난하냐?
아직까진 제대로 된 거란 얘기입니다.
이제부터 한글이 제대로 보이도록 하는 작업을 합니다.
파일을 다운받는데 iTextAsian.jar 라는 파일을 받습니다.
자세히는 모르겠는데 iText.jar와 연계해서 2바이트 코드를 PDF생성시
가능하게 해 주는 것 같습니다.
다운받은 iTextAsian.jar 를 iReport의 lib 폴더에 넣어줍니다.
이 문서에서는 C:/Program Files/JasperSoft/iReport-1.2.5/lib 에 복사했습니다.
iReport를 다시 실행시킵니다.
(노파심; 현재 iReport가 화면에 떠 있으면 닫고 다시 iReport를 실행해야 합니다.)
좀 전에 만든 D:/TEST/report01.jrxml을 불러들입니다.
그리고 한글이 보일 항목을 지정하고 옆에 Element Properties 창에서
PDF Font에 HYGoThic-Medium 를
PDF Encoding에 UniKS-UCS2-H (Korean)를 지정하고
다시 PDF Preview를 해봅니다.
한글이 잘 보이는가요?
잘 보여야 합니다.
더 이상은 나도 잘 모르기 때문에....
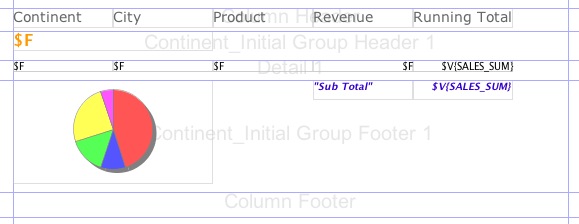
잘 보이면 보고서를 좀 더 다듬죠.
영어로된 항목명을 적당히 한글로 고쳐주고 이 때도 폰트를 맞춰줘야 합니다.
(위에 설명한 폰트말고 몇 개가 더 되는게 있는데 그건 각자 찾아 보십시오.)
이 문서에서는 이렇게 다듬었습니다.


참고로 위의 폰트 설정은 나중에 웹보고서 출력시 PDF로 출력할 때
한글을 보여주려고 하기 때문입니다.
위와 같이 설정하고 실행하는 웹어플리케이션에서 PDF로 볼 때 iTextAsian.jar를
찾지 못하면 에러가 납니다.
하지만 애플릿뷰어로 보여줄 때는 맞춰 줄 필요 없습니다.
이제 iReport로 작업하는 것은 이것으로 끝냅니다.
iReport의 디자인 방법이나 다른 기능들은 이 문서에서 설명하지 않습니다.
이 문서의 목적은 웹보고서를 어떻게 구현하는가에 초점을 맞추고 있기 때문입니다.

지금까지 한 것은 자동완성기능인 Report Wizard 를 이용한 것입니다.
수동으로 만드는 것도 각자 연습해 보시기 바랍니다.
아마 다른 비쥬얼툴을 사용해 보신 분이라면 어려움 없이 하실 수 있을 겁니다.
첨부파일을 이용하기
다음은 이 보고서를 웹을 통해 보여주어야 하기 때문에
웹어플리케이션을 하나 만듭니다.
아래의 첨부파일을 풀어서 톰캣이 웹어플리케이션으로서
인식하도록 합니다.


첨부파일 : MyWeb02.zip
웹어플리케이션을 만드는 부분은 설명하지 않습니다.
제 블로그를 보시거나 다른 사이트를 참조하시기 바랍니다.
이제부터 첨부파일의 구조대로 설명합니다.
이 문서에서는 톰캣을 이용하여 MyWeb02라는 웹어플리케이션을 생성했고
그 구조는 다음과 같습니다.


이 예제 웹어플리케이션을 실행하기 위해서는 준비과정이 필요합니다.

예제 소스에는 모든 라이브러리 파일은 담지 않았습니다.

파일크기도 커지고 각자 해 보는 것이 좋기 때문입니다.

예제에 필요한 파일 복사해 넣기

/MyWeb02/WEB-INF/lib 에는 첨부파일에도 아무것도 들어있지 않는데

이 폴더에 아래의 파일들을 복사해 넣으십시오.

- JasperReports를 압축해제한 폴더의 밑의 lib 안의 모든 JAR 파일
- jasperreports-1.2.5.jar
- jasperreports-1.2.5-applet.jar
- iTextAsian.jar
- postgresql-8.1-407.jdbc3.jar
- /struts-blank 웹어플리케이션의 lib 안의 모든 파일

참고로 아래는 이 문서 작성시 /MyWeb02/WEB-INF/lib 에 들어있던 파일리스트입니다.

예제 프로그램을 실행시키기 위해서 이 파일들이 모두 필요하진 않습니다.
좀 더 가볍게 실행시키시고 싶은 분은 필요없는 것은 지우셔도 상관없습니다.
제 경우에는 잘 모르기 때문에 하나씩 지우면서 웹 어플리케이션이 실행되나 안되나
시험하면서 정리를 했었는데 나중에 귀찮아서 그냥 전부 넣고 돌립니다.

[/MyWeb02/WEB-INF/lib]
ant-1.5.1.jar
antlr-2.7.5.jar
antlr.jar
commons-beanutils-1.5.jar
commons-beanutils.jar
commons-collections-2.1.jar
commons-digester-1.7.jar
commons-digester.jar
commons-fileupload.jar
commons-javaflow-20060411.jar
commons-logging-1.0.2.jar
commons-logging-api-1.0.2.jar
commons-logging.jar
commons-validator.jar
groovy-all-1.0-beta-10.jar
hibernate3.jar
hsqldb-1.7.1.jar
itext-1.3.1.jar
iTextAsian.jar
jakarta-bcel-20050813.jar
jakarta-oro.jar
jasperreports-1.2.5-applet.jar
jasperreports-1.2.5.jar
jcommon-1.0.0.jar
jdt-compiler-3.1.1.jar
jfreechart-1.0.0.jar
jpa.jar
jxl-2.6.jar
list.txt
mondrian-2.0.1.jar
png-encoder-1.5.jar
poi-2.0-final-20040126.jar
postgresql-8.1-407.jdbc3.jar
servlet.jar
struts.jar
xalan.jar
xercesImpl.jar
xml-apis.jar


그리고 /MyWeb02/reports 에 위에서 iReport로 만든 파일을 넣어주는데

이 문서의 경우 보고서명(파일명)이 report01이었습니다.

그리고 report01.jrxml 파일은 잘 아는 곳에 저장을 해 두었습니다.

이 문서의 경우는 D:/TEST 였습니다.

그 report01.jrxml 과 iReport의 설치폴더 안에 보면 report01.jasper 파일이 있습니다.

위의 2개의 파일을 /MyWeb02/reports 에 넣어줍니다.

즉, report01.jrxml , report01.jasper 를 /MyWeb02/reports에 넣어줍니다.

다음, /MyWeb02/jsp 안에 java 파일이 2개 있습니다.

이 자바파일들을 컴파일해야 합니다.

이것도 컴파일한 클래스 파일을 넣을까 하다가 소스만 넣어 두었습니다.

명령행에서 컴파일 방법

- 우선 클래스패스에 같은 폴더에 들어있는 jasperreports-1.2.5.jar 를 더해 줍니다.

>set classpath=%classpath%;D:/tomcat_webapps/MyWeb02/jsp/jasperreports-1.2.5.jar[엔터]
-> 이 때 클래스패스에
%JAVA_HOME%libtools.jar
%JAVA_HOME%libdt.jar
가 잡혀있는 경우에는 위와 같이 해주면 되지만
이 문서에서의 환경에서는 환경변수에 CLASSPATH가 없었습니다.
그래서 위의 명령행에서 위의 폴더까지 들어가서
아래와 같이 클래스패스를 잡아주었습니다.
>set classpath=.;jasperreports-1.2.5.jar[엔터]

- 컴파일
>javac JRViewerSimple.java[엔터]
>javac EmbeddedViewerApplet.java[엔터]

다음은 서블릿 파일을 컴파일합니다.
이 파일은 /MyWeb02/WEB-INF/src/reports 안에
JasperPrintServlet.java
ReportServlet.java
라는 이름으로 들어 있습니다.

Eclipse 를 사용하시는 분이라면 쉽게 컴파일까지 하실 수 있을겁니다.
여기서는 Eclipse가 없을 때 명령행에서 컴파일하는 방법을 설명합니다.

우선 명령행으로 나가서 /MyWeb02/WEB-INF/src/reports 까지 들어갑니다.
그 다음 여기서도 필요한 클래스를 패스로 잡아주고 컴파일하겠습니다.
다음 명령을 넣어줍니다.

>set classpath=.;C:/Tomcat55/common/lib/servlet-api.jar;../../lib/jasperreports-1.2.5.jar;../../lib/commons-beanutils.jar;../../lib/commons-digester.jar;../../lib/postgresql-8.1-407.jdbc3.jar;../../lib/struts.jar

이 명령에 대한 설명은 생략합니다.
명령행에서 컴파일하는 법은 우선 다른 웹사이트를 참조하시기 바랍니다.
이 문서와 똑같이 진행시켜 왔다면 컴파일이 될 것입니다.

다음은 컴파일
>javac -d ../../classes ReportServlet.java[엔터]
>javac -d ../../classes JasperPrintServlet.class[엔터]

/MyWeb02/WEB-INF/classes/reports 안을 확인해 보면 클래스 파일들이
생성되어 있을 겁니다.

자~~~~ㅅ! 다~~ 되었습니다.

이제 웹어플리케이션 MyWeb02를 재로드하거나
톰캣을 재기동한 후 브라우저로 열어봅니다.

http://localhost:8080/MyWeb02

그러면

MENU


Applet View

PDF View
이런 화면이 나타납니다.
Applet View 를 선택하면
Report name : report01 report02
cond1 : ___________
cond2 : ___________


이런 화면이 나타납니다.
블로그 화면에선 좀 틀리네요.
화면 이미지를 넣을까하다가 중요한 것도 아니라서 관뒀습니다.
test 버튼을 누르면
iReport에서 JRViewer preview 로 본 화면이 나타날 것입니다.
여기서
혹시, 서버와 클라이언트 이렇게 두 대로 이 문서를 따라 하시는 분이 계신다면
클라이언트에서 서버에 접속해서 위의 페이지를 열었을 때
해당 클라이언트에 JRE가 설치되어 있지 않거나
JRE5.0 Update8 이하의 버전이 설치되어 있다면
아래의 화면이 나타날 것입니다.


예 버튼을 클릭하면 JRE를 설치하는 화면이 나옵니다.


동의함 버튼을 선택합니다.
설치가 진행됩니다.
설치가 끝나면 자동으로 혹은 지멋대로
C:/Program Files/Java/jre1.5.0_08 에 JRE가 설치되어 있습니다.
이 경로는 어디서 컨트롤 하는건지 알 수 가 없었습니다.
자동으로 여기에 설치되는 것 같은데 테스트한 운영체제도 역시
Windows2000이였는데 다른 운영체제에서도 같은 장소에 깔리는지는
체크해 보지 못했습니다.
하여간 설치가 된 후 애플릿 화면이 나오길 기대하시겠지만
현재는 에러가 납니다.
그것은 소스 안을 살펴보시면 알게되는데
http://localhost:8080/MyWeb02~~~ 라고 정의 되어 있기
때문입니다.
이 부분도 여러분의 환경에 맞게 서버명을 고쳐서 해 보시기 바랍니다.
그리고 밑에서 설명하는 policy 설정 툴은
C:/Program Files/Java/jre1.5.0_08/bin 안에 들어있습니다.
자~~ ... 여하튼 현재 서버도 클라이언트도 같은 머신이라는 가정하에
계속 갑시다.
서버와 클라이언트가 같은 머신이라면 이상없이 애플릿 화면이 나타날텐데
그 화면에서 프린터 아이콘을 눌러 인쇄를 하려 하면 현재로는 에러 화면이
나타날 것입니다.
이 에러를 잡느라 이틀동안 인터넷을 얼마나 많이 헤멧는지 모릅니다.
원인은 애플릿의 클라이언트 권한 문제였는데
다음과 같이 해서 우선 문제를 해결하시고
클라이언트에게 권한파일을 배포하시는 건 알아서 하시길 바랍니다.
(너무 무책임한 것 같지만 저도 잘 모르겠다는...)
하여간 다음을 보시고 판단하시길 바랍니다.
클라이언트의 명령 프롬프트로 나가서 아래 명령을 실행합니다.
>policytool[엔터]
다음과 같은 메세지가 나타납니다.


확인을 누른 다음
나타난 화면에서 정책항목추가 버튼을 선택합니다.
다음 화면에서 사용권한추가 버튼을 선택합니다.
사용권한 드롭다운리스트박스에서 AllPermission 을 선택합니다.
화면은 이렇게 됩니다.


다음은 확인을 선택합니다.
완료를 선택합니다.
파일->저장을 눌러
이 문서에서는
C:/Documents and Settings/Administrator 에 .java.policy 라는 파일명으로
저장합니다.
파일명 앞에 쩜(.)이 있는 것에 주의하시기 바랍니다.
노파심 : Windows2000이나 XP 사용하시는 분은 로그인한 유저의
루트 디렉토리에 만들어 줍니다.
서버가 아닙니다.
이 웹어플리케이션에 접근하는 클라이언트 입니다.
이렇게 설정이 끝났으면 좀 전의 웹어플리케이션을 처음부터 다시
실행해서 애플릿의 프린터 아이콘으로 인쇄를 해 보시기 바랍니다.
프린터 선택화면이 나오면 성공적으로 퍼미션 문제가 해결된 것입니다.
사실, 저는 이 자바의 퍼미션에 관해 자세히 모릅니다.
위에서 정의한 AllPermission은 좋은 설정이 아닐지 모르니 실제 적용에는
주의하시기 바랍니다.(혹시, 잘 아시는 분이 계시면 저에게도 알려주십시오.)
다음은 PDF 도 실행해 보십시오.
아마, 잘 될 것입니다.
이 문서의 환경과 같고 제가 올린 소스를 그대로 적용하신 분이라면
별문제없이 잘 실행될 것입니다.
이 문서를 작성하느라 제 운영체제를 세번이나 새로 설치해서
이 문서를 보며 재검증까지 마쳤으니까요.
( 그런대도 설명이 이모양이냐? 하시면 저도 어쩔수가 없다는.... )
이제 iReport를 이용한 웹보고서 출력 기능 설명은 끝났습니다.
첨부파일에 대한 자세한 설명은 하지 않았습니다.
설명을 드리지 않아도 제일 처음에 적은 것 처럼
이 정도는 해석하실 수 있는 분에게 맞춰서 작성한 문서입니다.
대신에 이 문서의 처음에 소개해 드린 나는나님의 블로그에 방문하셔서
매뉴얼을 다운받아서 살펴 보시면 많은 도움이 되실 것입니다.
(사실, 소스설명하기에는 실력이 딸려서리...)
또 한가지, 예제의 폼에 있는
cond1과 cond2 는 다른 보고서를 만들 때 SQL에 파라메터를 넘길 경우를
테스트하기 위해 만들어 둔 것입니다.
이 부분은 위의 나는나님의 매뉴얼을 보면서 공부를 해 보시기 바랍니다.
센스가 있으신 분들은 금방 하실 수 있으리라 믿습니다.
그리고 소스의 안에도 위의 두 개의 파라메터를 처리하는 부분이 같이 들어있습니다.
여러분의 몫으로 남겨 둡니다.
(
하다만듯한 느낌이지만 직접해 보시는 것이 나을 것 같습니다.
비록, 문장도 문서의 구성도 서툴지만 찢어진 신문을 읽는 것처럼
이런 문서를 읽는 분들이 있기 때문에 되도록이면 직접해 보시라고...
제 게으름의 변명입니다.
)
그리고, 아직 왜 그런지 정확하게 파악이 안됐지만
위의 JDK 5.0 환경에서 애플릿으로 보고서를 출력시
클라이언트에서 서버로부터 애플릿을 다운받아 볼 때 시간이 꽤 걸렷습니다.
그런데 환경을 J2SE1.4.2_12 로 바꾸고 재컴파일하여 실행하니 굉장히 빨라졌습니다.
하지만 어떤 클라이언트에서는 JRE5.0대가 깔려있는데도 상관없이
빠른 반응속도를 보이기도 했는데 정확하게 원인규명이 되지 않았습니다.
왜 마지막에 이런 내용을 적냐면요....
음...
제 테스트 과정이 이랬거덩요....
하핫.......
열공하세요.

[출처] http://soulcinder.egloos.com/124044

Posted by 1010
53.jasper&ireport2012. 5. 21. 19:55
반응형

출처 : http://dedup.me/blog/?page_id=68

JasperReport 순수 자바로 구현된 리포팅 툴 (문서출력)

IReport의 기본개념

  1. 레포트의 생성주기
  2. JRXML 소스와 Jasper파일
  3. 데이터 소스와 출력포멧
  4. 표현식(Expression)
  5. 표현식에서 Java사용하기
  6. 표현식에서 Groovy사용하기
  7. 표현식에서 JavaScript사용하기
  8. iReport에서 JasperReposrt확장기능 사용하기
  9. 간단한 프로그램

IReport의 구조

  1. 밴드
  2. 밴드의 프로퍼티

IReport의 엘리먼트

  1. 엘리먼트를 사용하는 방법
  2. 이미지 사용하기
  3. 텍스트 사용하기
  4. 그 외의 엘리먼트들
  5. Anchors

Fields,Parameters And Variables

  1. 필드 사용하기
  2. 파라미터 사용하기
  3. 변수 사용하기
  4. 레포트생성시 엘리먼트 실행하기

밴드와 그룹

  1. 밴드 수정하기
  2. 그룹 사용하기
  3. 그 외의 그룹옵션들

폰트와 스타일

Posted by 1010
53.jasper&ireport2012. 2. 6. 18:20
반응형

jreports.pdf


Posted by 1010
53.jasper&ireport2012. 2. 6. 18:16
반응형

JasperReports Ultimate Guide - Sample Reference - Schema Reference - Configuration Reference - API (Javadoc)

JasperReports - Data Source Sample (version 4.5.0)


Shows how custom or JavaBean-based data source implementations could be used to fill reports.

Download All Sample Source Files
Browse Sample Source Files on SVN


Main Features in This Sample

Data Sources

Custom Data Source

JavaBean Data Sources

TableModel Data Source


top

Data Sources Documented by Sanda Zaharia


Description / Goal
How to fill reports using data source objects.

Since
0.1.0

Other Samples
/demo/samples/csvdatasource
/demo/samples/xlsdatasource
/demo/samples/xmldatasource


Data Sources

Data sources are structured data containers used when filling generated reports. Compiled
JasperReport objects are now prepared to encapsulate their dynamic part of data within the generated report template.
The filling process relies on expression evaluations, variable calculations and successive iterations through the records of the supplied data source object. Every report section is filled step-by-step.
Usually, data are loaded into data source objects. The engine expects to receive either a
JRDataSource object as the data source of the report that it has to fill, or a java.sql.Connection when the report data is found in a relational database.
The
JRDataSource interface is very simple. Only two methods should implemented here:

public boolean next() throws JRException;
- called on the data source object by the reporting engine when iterating through the data at report-filling time
public Object getFieldValue(JRField jrField) throws JRException;
- provides the value for each report field in the current data source record
It is important to notice that the only way to retrieve data from the data source is by using the report fields. As a structured object, a data source object is more like a table with columns and rows containing data in the table cells. The rows of this table are the records through which the reporting engine iterates when filling the report and each column should be mapped to a report field, so that we can make use of the data source content in the report expressions. There are several default implementations of the JRDataSource interface, depending on the way the records in the data source are acquired.

Rewindable Data Sources

The JRRewindableDataSource is an extension of the JRDataSource interface, to which it adds the possibility of moving the record pointer back before the first virtual record. It adds only one method, called moveFirst(), to the interface.
Rewindable data sources are useful when working with subreports placed inside a band that is not allowed to split due to the isSplitAllowed="false" setting and there is not enough space on the current page for the subreport to be rendered.
All built-in data source implementations listed below are rewindable except for the JRResultSetDataSource, which does not support moving the record pointer back. This is a problem only if this data source is used to manually wrap a java.sql.ResultSet before passing it to the subreport. It is not a problem if the SQL query resides in the subreport template because the engine will reexecute it when restarting the subreport on the next page.

Data Source Implementations
JDBC data sources: the JRResultSetDataSource class
- Wraps a java.sql.ResultSet object. Represents the most commonly used data source implementations when report data are extracted from a relational database. If a java.sql.Connection is passed to the engine instead, it executes first the related query and stores the returned java.sql.ResultSet object in a JRResultSetDataSource instance.
JavaBean data sources: JRBeanArrayDataSource and JRBeanCollectionDataSource
- Represent implementations that can wrap collections or arrays of JavaBean objects. Each object inside the array or the collection will be seen as one record in this type of data source. The mapping between a particular JavaBean property and the corresponding report field is made by naming conventions. The name of the report field must be the same as the name of the JavaBean property as specified by the JavaBeans specifications.
Map-based data sources: JRMapArrayDataSource and JRMapCollectionDataSource
- These implementations are useful if the parent application already stores the reporting data available in-memory as java.util.Map objects. Each Map object in the wrapped array or collection is considered a virtual record in the data source, and the value of each report field is extracted from the map using the report field name as the key
TableModel data sources: the JRTableModelDataSource class
- Wraps a javax.swing.table.TableModel object. Columns in the wrapped TableModel object can be accessed either by their names or by their 0-based indexes.
XML data sources: the JRXmlDataSource class
- A data source implementation based on DOM, which uses XPath expressions to select data from the XML document. Records in the XML data source are represented by node elements selected through the XPath expression. Field values are retrieved from each record using the XPath expression provided by the field description (<fieldDescription> element in JRXML).
CSV data sources: the JRCsvDataSource class
- Represents an implementation for data sources which retrieve their data from structured text files, usually CSVs. Field values are retrieved using their column index.
XLS data sources: the JRXlsDataSource class
- Represents an implementation for data sources which retrieve their data from Excel documents (workbooks). Report-field mapping for this data source implementation is also based on the field column index.
Empty data sources: the JREmptyDataSource class
- Simulates a data source with a given number of virtual empty records inside. It is is used by the UI tools to offer basic report preview functionality, or in special report templates, or for testing and debugging purposes.
Data Source Providers

When creating a report template using GUI tools, a special tool for customizing the report's data source is needed. The JasperReports library comes with the JRDataSourceProvider interface that allows to create and dispose of data source objects. This is the standard way to plug custom data sources into a design tool.
A custom implementation of this interface should implement the following methods that allow creating and disposing of data source objects and also methods for listing the available report fields inside the data source if possible:
  • public boolean supportsGetFieldsOperation();
  • public JRField[] getFields(JasperReport report) throws JRException, UnsupportedOperationException;
  • public JRDataSource create(JasperReport report) throws JRException;
  • public void dispose(JRDataSource dataSource) throws JRException;

top

Custom Data Source Documented by Sanda Zaharia


Description / Goal
How to implement a custom data source from scratch.

Since
0.1.0


Custom Data Sources

The
datasource sample shows how to implement some of the data sources enumerated in the Data Source Implementations section. Using the same report template, it could be filled with data provided by any of these data sources, depending on the fill argument used with the ant command:
  • if the argument is fill1 then data will be extracted from the CustomDataSource object.
  • if the argument is fill2 then data will be extracted from the CustomTableModel object.
  • if the argument is fill3 then data will be extracted from the CustomBeanFactory object as JavaBean array.
  • if the argument is fill4 then data will be extracted from the CustomBeanFactory object as JavaBean Collection.
When the argument is fill1 the data source is created from scratch. It contains an array of Object arrays, representing records of data, and a record index:
 private Object[][] data =
  {
   {"Berne", new Integer(22), "Bill Ott", "250 - 20th Ave."},
   {"Berne", new Integer(9), "James Schneider", "277 Seventh Av."},
   {"Boston", new Integer(32), "Michael Ott", "339 College Av."},
   {"Boston", new Integer(23), "Julia Heiniger", "358 College Av."},
   {"Chicago", new Integer(39), "Mary Karsen", "202 College Av."},
   {"Chicago", new Integer(35), "George Karsen", "412 College Av."},
   {"Chicago", new Integer(11), "Julia White", "412 Upland Pl."},
   {"Dallas", new Integer(47), "Janet Fuller", "445 Upland Pl."},
   {"Dallas", new Integer(43), "Susanne Smith", "2 Upland Pl."},
   {"Dallas", new Integer(40), "Susanne Miller", "440 - 20th Ave."},
   {"Dallas", new Integer(36), "John Steel", "276 Upland Pl."},
   {"Dallas", new Integer(37), "Michael Clancy", "19 Seventh Av."},
   {"Dallas", new Integer(19), "Susanne Heiniger", "86 - 20th Ave."},
   {"Dallas", new Integer(10), "Anne Fuller", "135 Upland Pl."},
   {"Dallas", new Integer(4), "Sylvia Ringer", "365 College Av."},
   {"Dallas", new Integer(0), "Laura Steel", "429 Seventh Av."},
   {"Lyon", new Integer(38), "Andrew Heiniger", "347 College Av."},
   {"Lyon", new Integer(28), "Susanne White", "74 - 20th Ave."},
   {"Lyon", new Integer(17), "Laura Ott", "443 Seventh Av."},
   {"Lyon", new Integer(2), "Anne Miller", "20 Upland Pl."},
   {"New York", new Integer(46), "Andrew May", "172 Seventh Av."},
   {"New York", new Integer(44), "Sylvia Ott", "361 College Av."},
   {"New York", new Integer(41), "Bill King", "546 College Av."},
   {"Oslo", new Integer(45), "Janet May", "396 Seventh Av."},
   {"Oslo", new Integer(42), "Robert Ott", "503 Seventh Av."},
   {"Paris", new Integer(25), "Sylvia Steel", "269 College Av."},
   {"Paris", new Integer(18), "Sylvia Fuller", "158 - 20th Ave."},
   {"Paris", new Integer(5), "Laura Miller", "294 Seventh Av."},
   {"San Francisco", new Integer(48), "Robert White", "549 Seventh Av."},
   {"San Francisco", new Integer(7), "James Peterson", "231 Upland Pl."}
  };
  
  private int index = -1;
The next() and getFieldValue(JRField) are implemented in order to make possible iteration through data records and field values retrieving for a given record. Field names are assumed to be: the_city, id, name and street, in this order (see the /src/CustomDataSource.java source file).
 public boolean next() throws JRException
 {
  index++;
  return (index < data.length);
 }

 public Object getFieldValue(JRField field) throws JRException
 {
  Object value = null;
  String fieldName = field.getName();

  if ("the_city".equals(fieldName))
  {
   value = data[index][0];
  }
  else if ("id".equals(fieldName))
  {
   value = data[index][1];
  }
  else if ("name".equals(fieldName))
  {
   value = data[index][2];
  }
  else if ("street".equals(fieldName))
  {
   value = data[index][3];
  }

  return value;
 }
At fill time a CustomDataSource object is passed as argument to the fillReportToFile() method in the JasperFillManager class (see the the /src/DataSourceApp.java file): Let's take a look at related methods in the /src/DataSourceApp.java file:
 public void fill1() throws JRException
 {
  long start = System.currentTimeMillis();
  //Preparing parameters
  Map parameters = new HashMap();
  parameters.put("ReportTitle", "Address Report");
  parameters.put("DataFile", "CustomDataSource.java");

  JasperFillManager.fillReportToFile("build/reports/DataSourceReport.jasper", 
    parameters, new CustomDataSource());
  System.err.println("Filling time : " + (System.currentTimeMillis() - start));
 }
In order to figure out more on custom data sources behavior, just test this sample by running from the command line the ant clean javac compile fill1 view command. It will generate the sample report in the /build/reports directory, filling it with data extracted from the CustomDataSource object.

top

JavaBean Data Sources Documented by Sanda Zaharia


Description / Goal
How to fill reports with collections or arrays of JavaBean objects.

Since
0.1.0


JavaBean Data Sources

There are two data source implementations that can wrap collections or arrays of JavaBean objects. Both implementations rely on Java reflection to retrieve report field data from the JavaBean objects wrapped inside the data sources. These data sources can be used to generate reports using data already available in-memory in the form of EJBs, Hibernate, JDO objects, or even POJOs.
The
JRBeanArrayDataSource is for wrapping an array of JavaBean objects to use for filling a report with data, and the JRBeanCollectionDataSource is for wrapping a collection of JavaBeans. Each object inside the array or the collection will be seen as one record in this type of data source.
The mapping between a particular JavaBean property and the corresponding report field is made by naming conventions. The name of the report field must be the same as the name of the JavaBean property as specified by the JavaBeans specifications. For instance, to retrieve the value of a report field named
address, the program will try to call through reflection a method called getAddress() on the current JavaBean object.
Nested JavaBeans properties can be also accessed in a JavaBean data source. For example, if the current JavaBean object inside the data source is of type
Product and contains nested supplier information accessible by calling the getSupplier() method, which returns a Supplier object. In this case, to access the address property inside the Supplier object, a report field named supplier.address is required.
For backward-compatibility reasons, the current implementations still look into the field’s description first, to locate the the JavaBean property. If there is no description, then the report field name is used instead. If this default behavior is not desirable, especially if the field description is already used for other purposes, you can use special data source constructors that receive a flag called
isUseFieldDescription to suppress this behavior.
A special field mapping can be used to access the current JavaBean object itself. Thus, when a field uses
_THIS as description or name, the data source will return the current JavaBean object as field value.

JavaBean Data Sources Example

In our concrete example a factory class is used to provide JavaBean data sources either as JavaBean arrays or as JavaBean collections. The JavaBean is defined in the /src/CustomBean.java file. It contains 4 accessible properties, and a supplementary
getMe() method which returns a reference to the object itself:
public class CustomBean
{
 private String city;
 private Integer id;
 private String name;
 private String street;

 public CustomBean(
  String pcity,
  Integer pid,
  String pname,
  String pstreet
  )
 {
  city = pcity;
  id = pid;
  name = pname;
  street = pstreet;
 }

 public CustomBean getMe()
 {
  return this;
 }

 public String getCity()
 {
  return city;
 }

 public Integer getId()
 {
  return id;
 }

 public String getName()
 {
  return name;
 }

 public String getStreet()
 {
  return street;
 }
}
Note that one of the CustomBean properties is named city. In the report template there is no corresponding field named city. A field named the_city exists instead. In this case, the field mapping is done through the <fieldDescription/> as described in the JavaBean Data Sources section. The CustomBean object is reffered to as me, with the associated getter getMe() method:

<field name="the_city" class="java.lang.String">
<fieldDescription><![CDATA[me.city]]></fieldDescription>
</field>


The factory class is defined in the /src/CustomBeanFactory.java file. It contains an array of CustomBean objects and two getter methods:
public class CustomBeanFactory
{
 private static CustomBean[] data =
  {
   new CustomBean("Berne", new Integer(9), "James Schneider", "277 Seventh Av."),
   new CustomBean("Berne", new Integer(22), "Bill Ott", "250 - 20th Ave."),
   new CustomBean("Boston", new Integer(23), "Julia Heiniger", "358 College Av."),
   new CustomBean("Boston", new Integer(32), "Michael Ott", "339 College Av."),
   new CustomBean("Chicago", new Integer(39), "Mary Karsen", "202 College Av."),
   new CustomBean("Chicago", new Integer(35), "George Karsen", "412 College Av."),
   new CustomBean("Chicago", new Integer(11), "Julia White", "412 Upland Pl."),
   new CustomBean("Dallas", new Integer(47), "Janet Fuller", "445 Upland Pl."),
   new CustomBean("Dallas", new Integer(43), "Susanne Smith", "2 Upland Pl."),
   new CustomBean("Dallas", new Integer(40), "Susanne Miller", "440 - 20th Ave."),
   new CustomBean("Dallas", new Integer(36), "John Steel", "276 Upland Pl."),
   new CustomBean("Dallas", new Integer(37), "Michael Clancy", "19 Seventh Av."),
   new CustomBean("Dallas", new Integer(19), "Susanne Heiniger", "86 - 20th Ave."),
   new CustomBean("Dallas", new Integer(10), "Anne Fuller", "135 Upland Pl."),
   new CustomBean("Dallas", new Integer(4), "Sylvia Ringer", "365 College Av."),
   new CustomBean("Dallas", new Integer(0), "Laura Steel", "429 Seventh Av."),
   new CustomBean("Lyon", new Integer(38), "Andrew Heiniger", "347 College Av."),
   new CustomBean("Lyon", new Integer(28), "Susanne White", "74 - 20th Ave."),
   new CustomBean("Lyon", new Integer(17), "Laura Ott", "443 Seventh Av."),
   new CustomBean("Lyon", new Integer(2), "Anne Miller", "20 Upland Pl."),
   new CustomBean("New York", new Integer(46), "Andrew May", "172 Seventh Av."),
   new CustomBean("New York", new Integer(44), "Sylvia Ott", "361 College Av."),
   new CustomBean("New York", new Integer(41), "Bill King", "546 College Av."),
   new CustomBean("Oslo", new Integer(45), "Janet May", "396 Seventh Av."),
   new CustomBean("Oslo", new Integer(42), "Robert Ott", "503 Seventh Av."),
   new CustomBean("Paris", new Integer(25), "Sylvia Steel", "269 College Av."),
   new CustomBean("Paris", new Integer(18), "Sylvia Fuller", "158 - 20th Ave."),
   new CustomBean("Paris", new Integer(5), "Laura Miller", "294 Seventh Av."),
   new CustomBean("San Francisco", new Integer(48), "Robert White", "549 Seventh Av."),
   new CustomBean("San Francisco", new Integer(7), "James Peterson", "231 Upland Pl.")
  };  
		
 public static Object[] getBeanArray()
 {
  return data;
 }

 public static Collection getBeanCollection()
 {
  return Arrays.asList(data);
 }
}
Using the same report template, it could be filled with data provided either as CustomBean array or as CustomBean Collection, depending on the fill argument used with the ant command:
  • if the argument is fill3 then data will be extracted as JavaBean array, using the getBeanArray() method. At fill time, a JRBeanArrayDataSource object is passed as argument to the fillReportToFile() method in the JasperFillManager class.
  • if the argument is fill4 then data will be extracted as JavaBean Collection (java.util.List), using the getBeanCollection() method. At fill time, a JRBeanCollectionDataSource object is passed as argument to the fillReportToFile() method in the JasperFillManager class.
Let's take a look at related report filling methods in the /src/DataSourceApp.java file:
 public void fill3() throws JRException
 {
  long start = System.currentTimeMillis();
  //Preparing parameters
  Map parameters = new HashMap();
  parameters.put("ReportTitle", "Address Report");
  parameters.put("DataFile", "CustomBeanFactory.java - Bean Array");

  JasperFillManager.fillReportToFile("build/reports/DataSourceReport.jasper", 
    parameters, new JRBeanArrayDataSource(CustomBeanFactory.getBeanArray()));
  System.err.println("Filling time : " + (System.currentTimeMillis() - start));
 }

 public void fill4() throws JRException
 {
  long start = System.currentTimeMillis();
  //Preparing parameters
  Map parameters = new HashMap();
  parameters.put("ReportTitle", "Address Report");
  parameters.put("DataFile", "CustomBeanFactory.java - Bean Collection");

  JasperFillManager.fillReportToFile("build/reports/DataSourceReport.jasper", 
    parameters, new JRBeanCollectionDataSource(CustomBeanFactory.getBeanCollection()));
  System.err.println("Filling time : " + (System.currentTimeMillis() - start));
 }
In order to figure out more on JavaBean data sources behavior, just test this sample by running from the command line the ant clean javac compile fill3 view command and then ant clean javac compile fill4 view. It will generate the sample report filling it with data extracted from a JRBeanArrayDataSource data source, and then the same report will be generated with data extracted from a JRBeanCollectionDataSource data source.

top

TableModel Data Source Documented by Sanda Zaharia


Description / Goal
How to wrap a custom TableModel implementation into a report data source.

Since
0.3.3


TableModel Data Sources

In some Swing-based desktop client applications, the reporting data might already be available in the form of a
javax.swing.table.TableModel implementation used for rendering javax.swing.JTable components on various forms. JasperReports can generate reports using this kind of data if a given TableModel object is wrapped in a JRTableModelDataSource instance before being passed as the data source for the report-filling process.
There are two ways to use this type of data source. Normally, to retrieve data from it, one must declare a report field for each column in the
TableModel object bearing the same name as the column it maps. Sometimes it is not possible or desirable to use the column name, however, because the report field name and columns could still be bound to report fields using their zero-based index instead of their names.
For instance, if is known that a particular column is the third column in the table model object (index=2), then one could name the corresponding field "COLUMN_2" and use the column data without problems.
An example of
TableModel data source implementation is provided in the following section.

TableModel Data Source Example

In our example the
TableModel data source is implemented in the /src/CustomTableModel.java file. It contains an array of column names and an array of Object arrays, representing records of data in the data source. Column names are identical to their related field names in the report template: the_city, id, name and street. Methods required by the javax.swing.table.AbstractTableModel parent class are also implemented.
 public class CustomTableModel extends AbstractTableModel
 {
  private String[] columnNames = {"the_city", "id", "name", "street"};

  private Object[][] data =
  {
   {"Berne", new Integer(22), "Bill Ott", "250 - 20th Ave."},
   {"Berne", new Integer(9), "James Schneider", "277 Seventh Av."},
   {"Boston", new Integer(32), "Michael Ott", "339 College Av."},
   {"Boston", new Integer(23), "Julia Heiniger", "358 College Av."},
   {"Chicago", new Integer(39), "Mary Karsen", "202 College Av."},
   {"Chicago", new Integer(35), "George Karsen", "412 College Av."},
   {"Chicago", new Integer(11), "Julia White", "412 Upland Pl."},
   {"Dallas", new Integer(47), "Janet Fuller", "445 Upland Pl."},
   {"Dallas", new Integer(43), "Susanne Smith", "2 Upland Pl."},
   {"Dallas", new Integer(40), "Susanne Miller", "440 - 20th Ave."},
   {"Dallas", new Integer(36), "John Steel", "276 Upland Pl."},
   {"Dallas", new Integer(37), "Michael Clancy", "19 Seventh Av."},
   {"Dallas", new Integer(19), "Susanne Heiniger", "86 - 20th Ave."},
   {"Dallas", new Integer(10), "Anne Fuller", "135 Upland Pl."},
   {"Dallas", new Integer(4), "Sylvia Ringer", "365 College Av."},
   {"Dallas", new Integer(0), "Laura Steel", "429 Seventh Av."},
   {"Lyon", new Integer(38), "Andrew Heiniger", "347 College Av."},
   {"Lyon", new Integer(28), "Susanne White", "74 - 20th Ave."},
   {"Lyon", new Integer(17), "Laura Ott", "443 Seventh Av."},
   {"Lyon", new Integer(2), "Anne Miller", "20 Upland Pl."},
   {"New York", new Integer(46), "Andrew May", "172 Seventh Av."},
   {"New York", new Integer(44), "Sylvia Ott", "361 College Av."},
   {"New York", new Integer(41), "Bill King", "546 College Av."},
   {"Oslo", new Integer(45), "Janet May", "396 Seventh Av."},
   {"Oslo", new Integer(42), "Robert Ott", "503 Seventh Av."},
   {"Paris", new Integer(25), "Sylvia Steel", "269 College Av."},
   {"Paris", new Integer(18), "Sylvia Fuller", "158 - 20th Ave."},
   {"Paris", new Integer(5), "Laura Miller", "294 Seventh Av."},
   {"San Francisco", new Integer(48), "Robert White", "549 Seventh Av."},
   {"San Francisco", new Integer(7), "James Peterson", "231 Upland Pl."}
  };

  public CustomTableModel()
  {
  }

  public int getColumnCount()
  {
   return this.columnNames.length;
  }

  public String getColumnName(int columnIndex)
  {
   return this.columnNames[columnIndex];
  }

  public int getRowCount()
  {
   return this.data.length;
  }

  public Object getValueAt(int rowIndex, int columnIndex)
  {
   return this.data[rowIndex][columnIndex];
  }
 }
When the ant command is used with the fill2 argument, at fill time a JRTableModelDataSource object is passed as argument to the fillReportToFile() method in the JasperFillManager class (see the /src/DataSourceApp.java file):
 public void fill2() throws JRException
 {
  long start = System.currentTimeMillis();
  //Preparing parameters
  Map parameters = new HashMap();
  parameters.put("ReportTitle", "Address Report");
  parameters.put("DataFile", "CustomTableModel.java");

  JasperFillManager.fillReportToFile("build/reports/DataSourceReport.jasper", 
    parameters, new JRTableModelDataSource(new CustomTableModel()));
  System.err.println("Filling time : " + (System.currentTimeMillis() - start));
 }
Running the Sample

Running the sample requires the Apache Ant library. Make sure that ant is already installed on your system (version 1.5 or later).
In a command prompt/terminal window set the current folder to demo/samples/datasource within the JasperReports source project and run the > ant test view command.
It will generate all supported document types containing the sample report in the demo/samples/datasource/build/reports directory.
Then the report will open in the JasperReports internal viewer.


© 2001-2010 Jaspersoft Corporation www.jaspersoft.com
Posted by 1010
53.jasper&ireport2012. 2. 6. 18:10
반응형

public static void main(String[] args) {
        Map map = new RenderReportBean().execute("northwind", "OrdersReport");
 
    }
 
    @SuppressWarnings({ "rawtypes", "unchecked" })
    public Map execute(String sourceFileId, String templateId, Integer[] formats) {
        Map params = new HashMap();
        Document document;
        Map<Integer, Boolean> renderedSuccessList = new HashMap<Integer, Boolean>();
        try {
 
            document = JRXmlUtils.parse(JRLoader.getLocationInputStream(sourceFileId + ".xml"));
 
            params.put(JRXPathQueryExecuterFactory.PARAMETER_XML_DATA_DOCUMENT, document);
            params.put(JRXPathQueryExecuterFactory.XML_DATE_PATTERN, "yyyy-MM-dd");
            params.put(JRXPathQueryExecuterFactory.XML_NUMBER_PATTERN, "#,##0.##");
            params.put(JRXPathQueryExecuterFactory.XML_LOCALE, Locale.ENGLISH);
            params.put(JRParameter.REPORT_LOCALE, Locale.US);
 
            JasperCompileManager.compileReportToFile(templateId + ".jrxml", templateId + ".jasper");
 
            JasperFillManager.fillReportToFile(templateId + ".jasper", params);
 
            JasperExportManager.exportReportToPdfFile(templateId + ".jrprint", sourceFileId + ".pdf");
 
 
        } catch (Exception e) {
            e.printStackTrace();
            return renderedSuccessList;
        }
        return renderedSuccessList;
    }
Posted by 1010
53.jasper&ireport2012. 2. 2. 14:16
반응형

Simple Guide To Sub-reports in JasperReports / iReport

Reporting tools… why is it so hard??

It seems like it’s practically a requirement that all business reporting tools be difficult to learn, use and work with. JasperReports / iReport is no different. Don’t get me wrong it’s a good solution to a certain kind of problem (and it’s free and open source which doesn’t hurt), but the iReport UI is (and I’ll try to be kind) utilitarian at best.

Anyhow, to do any non-trivial report with iReport, you’ll probably need to use sub-reports, which are not very clearly documented as to how the hell they work.

I’ll be talking strictly about Java-bean collection data sources for this article, so you will need to translate if you are doing direct SQL queries or something else.

The Java-bean data source is nice because we can utilise our existing domain layer in order to create our report, rather than replicating the same logistics in SQL (or worse – stored procedures) and thereby having two places to update when requirements change.

To easily understand how sub-reports work, we need to understand how JasperReports works in general.

JasperReports are stored in XML files (JRXML) – if you’ve created any report you’d be familiar with these files. These XML files are translated to Java source code by JasperReports, and then compiled into regular Java CLASS files, which are executable by the Jasper engine. You could say that Jasper compiles the JRXML files into Java, and then Java will compile these into byte code.

When you execute a report you are essentially executing Java code. Keep this in mind when filling out expression fields in your report, and things will start to make more sense.

Generally you use a sub-report in a situation where you have a two or more child lists of data relating to a single parent element. A common use case would be a report with multiple details bands of different types. I say “different types”, because if you have nested children that relate to the same data set, then generally you can achieve formatting using groups with breaking on certain fields in the data set. Things get complicated though where you have one big report, which has multiple unrelated data sets inside it.

To avoid getting too meta – here’s a concrete example…

This report has a single main detail band (contact details – first and last names) and two sub-detail bands for each contact – addresses and phone numbers.

In Jasper we need to use two sub-reports to implement this. But before we get too far, let’s look at how we would create Javabeans to store this data.

The addresses:

package com.visural.report;

public class AddressBean {

private String type;
private String address;

public String getAddress() {
return address;
}

public void setAddress(String address) {
this.address = address;
}

public String getType() {
return type;
}

public void setType(String type) {
this.type = type;
}
}

The phone numbers:

package com.visural.report;

public class PhoneBean {

private String type;
private String number;

public String getNumber() {
return number;
}

public void setNumber(String number) {
this.number = number;
}

public String getType() {
return type;
}

public void setType(String type) {
this.type = type;
}
}

And the contact (parent) bean:

package com.visural.report;

import java.util.List;

public class ContactBean {

private String firstName;
private String lastName;
private List addresses;
private List phones;

public List getAddresses() {
return addresses;
}

public void setAddresses(List addresses) {
this.addresses = addresses;
}

public String getFirstName() {
return firstName;
}

public void setFirstName(String firstName) {
this.firstName = firstName;
}

public String getLastName() {
return lastName;
}

public void setLastName(String lastName) {
this.lastName = lastName;
}

public List getPhones() {
return phones;
}

public void setPhones(List phones) {
this.phones = phones;
}
}

Finally, we need a test data source to use in developing our report. Here’s the factory for the report pictured earlier…

package com.visural.report;

import java.util.Arrays;
import java.util.List;

public class ContactFactory {

public static List create() {
ContactBean stub = new ContactBean();
stub
.setFirstName("John");
stub
.setLastName("Smith");

AddressBean address1 = new AddressBean();
address1
.setType("Home");
address1
.setAddress("123 Fake St\nFaketown\nFK 12345");
AddressBean address2 = new AddressBean();
address2
.setType("Work");
address2
.setAddress("321 Bogus St\nFaketown\nFK 12345");
stub
.setAddresses(Arrays.asList(address1, address2));

PhoneBean phone1 = new PhoneBean();
phone1
.setType("Home");
phone1
.setNumber("03 9876 1234");
PhoneBean phone2 = new PhoneBean();
phone2
.setType("Work");
phone2
.setNumber("03 1234 9876");
PhoneBean phone3 = new PhoneBean();
phone3
.setType("Mobile");
phone3
.setNumber("0432 123 456");
stub
.setPhones(Arrays.asList(phone1, phone2, phone3));

return Arrays.asList(stub);
}
}

The thing to notice here is that we have modelled the Javabeans exactly as we would if they were being used for some other purpose, i.e. we haven’t done anything special to make them usable in JasperReports / iReport.

In Jasper we configure a Javabeans data source that is created from a Collection, using our ContactFactory.create() method. We then add fields as follows, and create our report layout:

Note that the field names correspond to the Javabean property names.

Now for the important part. We then need to set the data source on the sub-report’s properties:

So we can just use an “data source expression” as our connection for the sub-report, and for the expression we create a data source on the fly using our collection of java beans from our current data source’s “addresses” and “phones” fields. “new net.sf.jasperreports.engine.data.JRBeanCollectionDataSource(datasource.getPhones())” is the Java code we would write if we were to create a Javabean data source in our regular Java code. JasperReports will replace $F{phones} with “datasource.getPhones()” (or its equivalent) as part of it’s JRXML to Java compilation process.

The rest is simple; our sub-reports define fields that match the AddressBean and PhoneBean properties:

With all that in mind, it really is a case of “it’s simple when you know how”, but be that as it may, I couldn’t find a concise description of how to do this in my googling. Hopefully this post will fill that gap. Perhaps everyone is still writing SQL-based reports against a single database? :) I don’t know, but using Javabeans is a nice flexible alternative to use SQL-based reports that gives you a lot of options in the long term.

If you’re still confused you can download the above code, and the JRXML reports in a Netbeans 6 project here.

Also, try one of these books. Jasper & iReport’s documentation is pretty thin online, so having a reference book can be handy –

Posted by 1010
53.jasper&ireport2012. 1. 25. 13:22
반응형

JavaBeans as datasource in JasperReports

JasperReports is very flexible report generation tool on both beginner as well as enterprise level. It supports many data access mechanisms for retrieving data and rendering to the report like SQL, EJBQL, HSQL, XML, JavaBeans, XPath etc. But here our main focus is on the usage of JavaBeans.

I have divided the whole task of report generation into certain activities as shown below:
1. Create a simple Java Class (JavaBean) with properties and their accessors and mutators.
2. Design a report either manually or you can use IDE like iReports for that, I have used iReports.
3. Compile the report using Java and run it to test whether its working or not.

We will start with step 1:
Create a simple Java Class thats a simple POJO(Plain Old Java Object) its contains the data for the report. You can take any entity for that, I am here taking a simple entity Student and creating a Java file shown below with the name Student.java.

package beansforjasper;

public class Student
{
private String name;
private String roll_no;
private String fathers_name;
private String studying_in;

public String getName() {
return name;
}
public void setName(String name) {
this.name = name;
}
public String getRoll_no() {
return roll_no;
}
public void setRoll_no(String roll_no) {
this.roll_no = roll_no;
}
public String getFathers_name() {
return fathers_name;
}
public void setFathers_name(String fathers_name) {
this.fathers_name = fathers_name;
}
public String getStudying_in() {
return studying_in;
}
public void setStudying_in(String studying_in) {
this.studying_in = studying_in;
}
}

In addition to the above code we have to add a static method that returns a collection. This will be used as datasource for report. I have made a simple static method as follows:


public static Collection getStudentList()
{
Vector students = new Vector();
try
{
Student student = new Student();
student.setRoll_no("101");
student.setName("Steve");
student.setFathers_name("Jack");
student.setStudying_in("I-A");
students.add(student);
student = new Student();
student.setRoll_no("102");
student.setName("Mark");
student.setFathers_name("Henry");
student.setStudying_in("I-A");
students.add(student);
}
catch(Exception ex)
{
System.out.println(ex);
}
return students;
}


Thats all for as far as datasource for report is concerned.


Step 2 (The iReports part):
Create a new report in iReports as show in diagram 1.

Diagram 1

Now create a new datasource by clicking on "Report Datasources" button on toolbar. You will see a window showing the tabular representation of the all existing datasources. Now click on "New" button and you will see datasource types as shown in Diagram 2 below:

Diagram 2

Now select JavaBean set datasource and click on the "Next" button. This will take you to a new window, that will ask you for name, fully qualified class name of the factory class that will generate set and of course the static method thats going to return either Collection or Array of JavaBeans. Be care full to select the radio button specific to the return type of your static method. This is shown in Diagram 3 below:

Diagram 3

After doing all this work when you click on "Test" button an error will be generated, this is mainly because the class path is not set for our "Student.class" file. To set classpath follow steps below:
1. Goto Tools(Menu)>>Options
2. Select iReport tab and then select "Classpath" tab now click on "Add Folder" if you have only class file and add directory containing it else "Add JAR" if you have distributable jar file.

After the classpath is set Now its time to add data fields so that these can be used in our report.
In order to do that Right click the Report Node(Root Node) in the "Report Inspector" and choose "Edit Query" from popup menu. A window will appear choose "JavaBean Datasource" tab in that window as shown below:

Diagram 4

Provide the fully qualified class name of the JavaBean and click on "Read Attributes" you will see all the fields that this class contains. Select the fields that you want to make available for the report and then click on "Add Selected Fields".

I have created a simple design just to show you how easy it is to create reports with iReport. My sample is shown as Diagram 5.

Diagram 5


This is actually an attemp to show how JavaBeans can be used as datasource for the JasperReports.
Here I have used iReport 3.7.2.

On clicking the preview its generates preview as as shown below in Diagram 6.

Diagram 6

Step 3(Compilation and Test using Java)
To test this demo using a Java program we can use the following code:


public static void main(String[] str)
{
try
{
JasperReport jasperReport = null;
JasperPrint jasperPrint = null;
JasperDesign jasperDesign = null;
Map parameters = new HashMap();
jasperDesign = JRXmlLoader.load("<Path of Report>");
jasperReport = JasperCompileManager.compileReport(jasperDesign);
jasperPrint = JasperFillManager.fillReport(jasperReport, parameters, new JRBeanCollectionDataSource(beansforjasper.Student.getStudentList()));
JasperExportManager.exportReportToPdfFile(jasperPrint,"StudentInfo.pdf");
JasperViewer.viewReport(jasperPrint);
}
catch(Exception ex)
{
System.out.println("EXCEPTION: "+ex);
}
}


This will generate a "StudentInfo.pdf" file and will invoke Jasper report viewer that will show you the generated report.

Remember to put the dependencies at the classpath while running the above program.
Posted by 1010
53.jasper&ireport2012. 1. 19. 16:18
53.jasper&ireport2012. 1. 19. 16:17
반응형

4 Connections and Datasources

Data to print can be retrived in several ways from different places like a database or a XML file. This data is presented to JasperReports always in form of records using a special interface called JRDataSource. JasperReports comes with a good set of implementations of this interface to wrap JDBC ResultSets, TableModels, Collections, Vectors and Arrays of objects, etc... But not always a JRDataSource is needed to supply data to the report in order to fill it. In fact JasperReports can execute yourself sql queries using a given opened Connection to a database, and use the result to fill the report. How we'll see, this features will be very useful and easy to use.

4.1 Types of datasource

iReport supports JDBC connections and 4 types of datasource (that can be used to wrap any kind of custom datasource).
  • Empty data source (JREmptyDatasource): is a special datasource used to fill report that don't expose any records. This datasource is used when you press the button to "run" a report.
  • XML DataSource (not yet implemented): is a datasource capable to wrap an XML file and normalize its content.
    Fig.4.1: XML datasource definition.
    The only informations needed to create this type of datasource are a name (for the datasource) and the name of the XML file.


  • JavaBeans Set Datasource (not yet implemented): is a datasource capable to wrap a Collection or an Array of JavaBeans.
    Fig.4.2: JavaBeans Set datasource definition.
    How all the rest of datasources used by iReport and presented here, this datasource need a spacial factory class that provides a static method to generate a collection or an array of JavaBeans (alias a set of Objects).
    To create this datasource you need a name for the datasource, the name of a class that will provide the static method to call to retrive the Array/Collection of Objects and the name of this method that will have a definition like this:

    public static Collection createMyCollection()
    or
    public static Object[] createMyArray()

    Remember to set the type of result (Collection or Array).

  • Custom Datasource: this type of datasource is generic. iReport don't know how the JRDataSource is implemented by this particular connection but it's not important.
    Fig.4.3: Custom JRDatasource definition.
    This datasource need a spacial factory class that provides a static method that return a JRDataSource.
    To create this datasource you need a name for the datasource, the name of a class that will provide the static method to call to retrive the JRDataSource and the name of this method that will have a definition like this:

    public static JRDataSource createMyJRDataSource()


An example of implementation of a custom datasource is provided at the end of this chapter.


4.2 Setting up a JDBC connection

To set up a JDBC connection we need a running JDBC capable DBMS (I like MySQL), an appropriate JDBC driver to access it, a database and a valid account. Are you ready? Let's go!
Select the menu Datasources > Connection/Datasources. Will appeare the frame with the list of datasources and JDBC connections that you have defined. Please note that you can define how many datasources and connecgtions you want but you can, for now, use only one at time. We'll see how set the "Active connection". Press the "New" button.
Fig.4.4: JDBC connection definition frame.
In the new frame, write a connection name (i.e. "My First JDBC connection"), select the right JDBC driver, you can specify one writing it directly or use one already present in the list. Please note that this drivers are not shipped with iReport (except MySQL driver), be sure that the driver that you want use is in the classpath. Putting a jar in the lib directory of iReport can be a good idea, but the jars present in this directory are added to the CLASSPATH only when iReport start. For now it's not possible change the classpath of iReport 2 dinamically.
Before write the URL, write the database name, then press the button "Wizard". In this way, if iReport recognize the driver, it will suggest a URL to use with.
Set the username and the password, then test the connection pressing the Test button.
Fig.4.5: The connection is OK.
If all it's OK, a dialog box (Fig. 4.5) will inform you of the test success.
Many software use a very similar way to setting up a JDBC connection. You can refer to the specific JDBC driver documentation to know all options offered by the driver and the exact syntax of the URL.
All most used DBMS have a JDBC driver. If you need to access a database via ODBC on a Win32 system, you can use the JDBC-ODBC brigde, a special JDBC driver developed by Sun Inc.. But I suggest to verify first the presence of a JDBC driver.

iReport for default don't store connection passwords. If you want store it, you must first check the "Save password" checkbox. Press the "Save" button to definitly store the connection in the iReport connections pool.


4.3 Setting up a custom datasource

I will not bore to you with other basic slight notions on which button you must press in order to execute what is written on it...
If you have not, read the previous paragraph that explains where put hands to create a new datasource/connection. You only should to kwnow that you can choose the type of your datasource selecting it by the combobox in the connection frame.
When you have filled all fields, test it with the test button.


In this session we have created a simple report, saved as XML file, compiled as jasper file, filled with an "EmptyDataSource" end exported in PDF.


4.4 Implementing a new custom datasource

This topic is more a JasperReports releated argument, than an iReport feature explanation. But I think that can be useful know how you can develope your custom data driver (alias JRDataSource).
We will write a very simple JRDataSource that retrive fields from a CSV file. A CSV file is a text file that contains a set row. Any row contains a cartain number of fields separated by a special character (i.e. teh semicolon ';').
What must do our datasource is retrive this rows and return the right value to JasperReport when it ask for a fields (or column). What we have to do is implement this very simple interface:

package dori.jasper.engine;

public interface JRDataSource
{
public boolean next() throws JRException;
public Object getFieldValue(JRField jrField) throws JRException;
}

A JRField is a vary simple class to. It contains the name of the field (a String), and the java Class that represents the type of this field. In our case all fields are of type String, but we can choose to use as field name (alias the column name) the values of the first row of our cvs file or a generic name as COLUMN_1, COLUMN_2, ... This is the same way used by JasperReport in implementation of the TableModel wrapper datasource, that can indifferently use as column name the value of the column header (if present) or the special name COLUMN_<n> with n in the set {0,1,2,3,...,k}.
We'll use fixed names to refer columns in our datasource (COLUMN_1, COLUMN_2, ...).
This is the code:

1   
2   
3   import java.io.*;
4   import java.util.*;
5   
6   public class JRCSVDataSource implements dori.jasper.engine.JRDataSource {
7       
8       String row = "";
9       LineNumberReader lineNumberReader;
10      
11      /** Creates a new instance of JRCVSDataSource */
12      public JRCSVDataSource(String cvsFile) {
13          try {
14              lineNumberReader = new LineNumberReader( new FileReader(cvsFile));
15          } catch (Exception ex) { }
16      }
17      
18      public Object getFieldValue(dori.jasper.engine.JRField jRField) throws dori.jasper.engine.JRException {
19          String field = jRField.getName();
20          int fieldPosition = Integer.parseInt(field.substring(7)); // Strip COLUMN_ 
21          StringTokenizer st = new StringTokenizer(row,";");
22          while (st.hasMoreTokens())
23          {
24              fieldPosition--; // The column is not 0 indexed.
25              String token = st.nextToken();
26              if (fieldPosition == 0) return token;
27          }
28          return null; // Column not found...
29      }
30      
31      public boolean next() throws dori.jasper.engine.JRException {
32          try {
33              row = lineNumberReader.readLine();
34              if (row.length()>0) return true;
35          } catch (Exception ex) { }
36          return false;
37      }   
38  }
How you can see, only 38 lines of code... It's time to test it...
We'll write a little "JRDataSourcFactory" in order to use it with iReport. This factory will instance a JRCSVDataSource and will return it with the static method: getTheDatasource()
1   package it.businesslogic.ireport.connection;
2   
3   public class CSVDatasourceTestFactory {
4       
5       public dori.jasper.engine.JRDataSource getTheDatasource( )
6       {
7           return new JRCSVDataSource("test.csv");
8       }
9   }
10  
Open iReport, create a new custom JRDataSource connection and fill all fields as in Fig. 4.6, test and save the connection.
Fig.4.6: The new CSV datasource connection.

Now go to Build > Set active connection and select our new connection ("CSV Datasource (test.csv)")
Fig.4.7: Set the active connection.
This is the result. We'll soon learn how to create the trial report used to test our datasource.
Fig.4.8: The result print.
Posted by 1010
53.jasper&ireport2012. 1. 19. 15:29
반응형
Posted by 1010
53.jasper&ireport2012. 1. 19. 15:22
반응형
Posted by 1010
53.jasper&ireport2012. 1. 19. 15:15
반응형

Jaspersoft iReport: How to pass a parameter to a sub-dataset


Jaspersoft iReport: How to pass a parameter to a sub-dataset

Let’s say our main report is grouped by continent and the details band holds sales figures for each country. We would like to add now a pie chart to the group footer to visualize the share by product by continent.


Imagine our main report query is:

SELECT
product_sales.`continent` AS product_sales_continent,
product_sales.`city` AS product_sales_city,
product_sales.`product` AS product_sales_product,
product_sales.`sales` AS product_sales_sales
FROM
`product_sales` product_sales
ORDER BY
1, 2, 3

To add a sub-dataset right click on the report root element and choose New Dataset:
Follow the wizard instructions and insert a query. In our imaginary case it is something like this:

SELECT
product_sales.`product` AS product_sales_product,
SUM(product_sales.`sales`) AS product_sales_sales
FROM
`product_sales` product_sales
GROUP BY 1
ORDER BY 1

You must have noticed that there is something missing: This is of course not our final query, we want to restrict the results by continent. In order to do that, we have to first pass the parameter to the sub-dataset.

Now let’s have a look at how this is done:
  1. Create the parameter within the sub-dataset: Give it a name in the properties panel and make sure that the parameter class is the same as for the parameter that you want to pass from the main query. Also, untick Use as a prompt:
  2. Now add a chart to the design area. Right click on it and choose Chart Data:
  3. Specify all the standard settings for the chart (Connection etc), then click on Parameters and Add. From the top pull down menu Dataset parameter name choose the sub-dataset parameter we just created before. Click on the button next to Value expression: You can now choose from the parameters, fields and variables of the main dataset. In our case, we just choose the continent field:
    Apply, Click Apply, OK, and Close.
  4. Now we can finally change our SQL query in a way that it looks like we originally intended it to be. Therefore, right click on the dataset and choose Edit Query:
    Now add a WHERE clause to the query like this one:WHERE
    product_sales.`continent`=

    From the right hand side, you can
    drag over the parameter. It should then look like this:OK.


For your reference, please find the whole last SQL query below:
SELECT
product_sales.`product` AS product_sales_product,
SUM(product_sales.`sales`) AS product_sales_sales
FROM
`product_sales` product_sales
WHERE
product_sales.`continent`=$P{CONTINENT_CHART}

GROUP BY 1
ORDER BY 1

Now everything will be working as intended. The parameter will now be passed from the main report to the chart (which is kind of a hidden sub-report). This method works for Lists, Tables and Crosstabs as well.

Posted by 1010
53.jasper&ireport2012. 1. 3. 13:59
반응형
Posted by 1010
53.jasper&ireport2012. 1. 3. 13:39
반응형

출처 : http://dalyal.tistory.com/entry/iReport의-Field-Parameter-Variable

이번에 알아볼것은 iReport에서 핵심을 이루고 있는 Text Field에 들어가는 것들 입니다.
DB에서 값을 가져오는 Field, 조건이나 가지고 있는 값 자체를 사용 할때 쓰는 Parameter,
Count나 Sum 등 연산에 자주사용되는 Variable 에 대해 알아 보겠습니다.

사용자 삽입 이미지


Document structure 부분입니다.
iReport에서 Default로 제공하는 부분을
빼고 (젤 아래부분 Filters에서 유무조절)
개발자가 작성한 부분만 표시되고 있습니다.

SUBREPORT_DIR은 subreport의 경로를
담고 있으며 연결에 사용됩니다

RCIV_DATE,RCIV_SEQ는 쿼리를 날려
얻어온 컬럼명입니다.

Variables는 얻어온 RCIV_SEQ의 합계를
얻기 위해 만든 변수입니다.


1. Parameters
사용자 삽입 이미지

- 실행시 외부에서 동적으로 Data를 받아오거나 Report끼리(특히 Subreport쓸떄) Data를
주고 받을때 사용됩니다. 자체적으로 제공하는 Parameter도 있습니다.
표기 형식은 $P{<parameter명>}이고 원하는 타입을 직접 설정해 줄 수 있습니다.
Use as a Prompt 부분에 체크를 해주면 실행시 Parameter값을 입력하는 창이 뜹니다.
Default Value Expression부분에는 Parameter값을 써줄수 있는데 값을 써줄때 그냥 값을
넣는게 아니라 위 그림처럼 그 타입에 맞게 생성해 주어야 한다.

2. Fields
사용자 삽입 이미지
- 개발자 임의로 생성하는게 아니라 SQL Query를 통해 받아온 Column명이 Fields입니다.
표기 형식은 $F{<column명>}이고 Type은 DB의 Table에 따릅니다.

3. Variables
사용자 삽입 이미지
- Variables는 보고서 내부에서 연산 결과 저장이나 특정 Data를 임시저장들을 할 때
사용합니다.
표기 형식은 $V{<variables name>} 이고 원하는 타입을 직접 설정해 줍니다.
Variable Expression에 값을 넣을수 있는데 Parameter에서 처럼 new BigDecimal(10)처럼
생성해주거나 위 그림 처럼 Fields을 써넣을 수도 있습니다.

그림을 보면 우측에 Variables속성 창에 Calculation Type' Option이 있는데
이 Option은 iReport에 내장되어 있는 내장 함수를 이용할 것인지를 선택하는 항목입니다.
만일 원치 않으면 'Nothing'을 선택하면 됩니다

* 내장함수 List:
Count - 입력 값의 수량 반환
Distinct Count - 입력 값의 수량 반환(중복x)
Sum - 입력 값의 합 반환
Average - 입력 값의 평균 반환
Lowest - 입력 값 중 가장 작은 값 반환
Highest - 입력 값 중 가장 큰 값 반환
Standard Deviation - 입력 값의 표준편차 반환
Variance - 입력 값 중 평방편차 반환
System - 연산에 사용되지 않지만 Memory에서 맨 마지막에 사용된 값을 반환
First - 맨 처음에 사용된 값을 반환

Posted by 1010
53.jasper&ireport2012. 1. 3. 13:39
반응형
출처 : http://dalyal.tistory.com/entry/iReport의-Elements-종류22

6. Subreport - Mainreport 안에 다른 보고서를 포함하는 것으로 각 보고서간에
서로 Parameter를 주고 받을 수 있고 독립적으로 서로 다른 보고서 결과를
(한마디로 다른 쿼리) 작성할 때 사용합니다.
* Edit / InsertElement / Subreport 를 클릭하거나 Toolbar에서 아이콘을 클릭해서
Mainreport안에 만들어 준다. ( 이때 크기는 Subreport크기랑 맞추어 주는 걸 추천한다)

사용자 삽입 이미지
* Subreport Connection방법인데 전 그냥 Default로 제공되는 방법을 이용했습니다.
(Mainreport랑 같은 방법으로 접속하는 방법)

사용자 삽입 이미지

* Mainreport에 Subreport를 연결하는 방법은 앞 장에서 본 Image연결과 비슷합니다
* Subreport Expression Class 에서 Type을 설정하고 밑부분에 주소를 써줍니다.

- java.lang.String - "C:\\bea\\(주소~~).jasper" <- Subreport 경로써줌
- java.io.File - new File(System.getProperty("config.dir") + "/(주소~).jasper")
<- 파일위치에 경로를 찾아가는 방식

* Subreport parameters 부분은 Main에서 Sub로 값을 넘길때 사용합니다

사용자 삽입 이미지

* Subreport return values는 Sub에서 Main으로 값을 넘길떄 사용하는데
Subreport Variable은 Subreport쪽에 만드는 것이고 Destination variable은
Mainreport 쪽에 만들어 놓는 것이다. 두 군데 모두 변수가 만들어져 있어야 가능하고
이부분은 Subreport의 컬럼 수나 함계, 통계등 변수값을 쓸때 사용합니다.


7. Chart - iReport에서는 보고서에 나타낼 수 있는 여러종류의 Chart를 지원하고
Edit / InsertElement / chart 나 Toolbar에서 찾아 클릭해 드래그 하면 됩니다.
바로 그래픽을 선택하는 부분이 나오고 Properties에서 기타 설정을 해줍니다

사용자 삽입 이미지

* 위 그림은 Chart부분에서 pie 모양 Chart에서 어디 위치에 값이 나오는지 보여주기 위해
예로 만든 Chart입니다.

8. Barcode tool - 값을 바코드 형식으로 보여주고 출력합니다.
바코드 인식기계에 그 값이 나타납니다.

9. Frame - iReport에 Frame을 나누어 줄때 씁니다.

10. Crosstab - 표 형식으로 여러 값을 출력 할 때 유용하게 사용할 수 있습니다.

11. Hyper Link - iReport에서는 HypeLink를 허용합니다. Static text와 graphic Element를
제외한 Elements에서 모두 설정 할 수 있습니다.

사용자 삽입 이미지

* Hyperlink Type
1.None - 링크가 없는 상태
2.Reference - Website로 link
ex)”http://www.naver.com”
3. LocalAnchor - 보고서 내부 특정band로 link
ex)”summary”
4.LocalPage - 보고서 내부의 특정page로 link
ex)new Integer(4)
5. RemoteAnchor - 다른 파일 band로 link
6. RemotePage - 다른 파일 특정 page로 link
=> Hyperlink는 PDF에서는 잘 되지 않았고 explore에서 실행해 보았습니다.
Posted by 1010
53.jasper&ireport2012. 1. 3. 13:38
반응형
출처 : http://dalyal.tistory.com/entry/iReport의-Elements-종류


 iReport의 Elements 종류로는 선,사각형,타원,이미지삽입,텍스트 등이 있고.
그 외의 것들로 subReport, Chart, Barcode tool, Frame, Crosstab 등이 존재합니다.
'>iReport상단에 Menu아래에 존재하고 위에 그림처럼 직관적으로 잘나타나져 있습니다

1. 선

선을 나타낸다. Line Direction 옵션에서 Top-down(기본값) ,Bottom-up의 두가지 모양이
있는데 두가지는 각기 우측상단에서 좌측하단으로 좌측상단에서 우측하단으로의 모양을
가지고 있습니다.(높이를 0으로 해주면 직선이 됩니다)
또 Graphics Element옵션에서 Pen 속성값으로 굵기를 선택해줍니다(Dotted는 점선)

2. 사각형

사각형을 표현할 때 사용된다. 다른 iReport 메뉴얼이나 작성법을 보면 Layout를 나눌때
많이 사용한다고 합니다.
또 사각형Element는 Rectangle에서 Rectangle radius라는 옵션이 있다. 0일때는
그냥 사각형이고 숫자값이 커질수록 사각형 모서리 부분이 뭉퉁하게 됩니다.(타원이 됨)

3. 타원

별다른 옵션이 없다. 그냥 타원입니다..

4. 이미지

보고서에 사진이나 이미지를 추가할때 사용합니다. Image Expression부분에 이미지 경로와
파일명을 적어주면 되는데 지원타입으로는 gif,jpeg등 다양합니다.
이미지경로를 작성하는 방법으로는 Image Expression Class 부분에서 Type을 정해주는데
저는 String이랑 File 방법을 사용해 보았습니다

java.lang.String - "C:\\이미지.jpeg" <- 경로써줌
java.io.File - new File(System.getProperty("config.dir") + "/이미지.jpeg")
<- 파일위치에 경로를 찾아가는 방식
그 외에 다른 방법은 직접 사용해 보면서 익히길 바랍니다..

5. 텍스트

iReport를 하면서 가장 많이 사용하는 부분이다. iReport에 사용하는 텍스트는 2가지 종류가
있고 그외의 옵션에 대해서도 알아 보겠습니다.

1)Static Text - 문자를 단순히 표현하는 Elements

2)Text Field - DB에서 추출된 Field값이나 Parameter 나 Variables을 표현하는 Elements
Text Field Expression Class에서 문자의 Type을 정해줄수 있습니다
Evaluation Time와 Group옵션에 대해서는 잘 모르겠던데
아시는 분 있으면 댓글 좀 달아주시면 감사하겠습니다..
Stretch with overflow - Elements 의 길이가 넘었는데도 값이 남아있다면
다음줄에 값이 나타난다.
Blank when null - 값이 null일 때는 빈칸으로 나타내어 준다.
Pattern - 날짜나 숫자값일때 표현패턴을 지정해 준다 (ex) ##.# -> 32.2
Text Field Expression - 표현할 값을 적어준다 ($F{} , $P{}, $V{} 등등)

* Border옵션 - Padding - Element Box와 문자 사이에 거리를 설정해준다.
Border - Element Box의 선을 편집해 준다
( 저는 이런 방식으로 보고서에 줄과 칸을 나눕니다. )

* 기타 Text옵션 - 굵게(Bold),이태리체(italic),밑줄(Underline)등 제공하는 옵션들이 있다.
정렬의 위치와 Element Box에서의 위치도 조절 할 수 있다.

* Static Text와 Text Field 둘다 F2로 편집이 가능하고 Static Text는 F3키로 편집이 가능한데
이떄 Text Field로 변환이 되어 버리니 조심해야 한다.

* Font - iReport는 여러 종류의 Font를 지원하고 외부 Font(TTF)는 classpath설정을 통해
할수 있다.
보고서를 PDF형식으로 생성을 한다면 PDF 보고서를 위한 Font설정도 해주어야 함

사용자 삽입 이미지

* Report Font - Menu/ Format /Fonts를 클릭하면 원하는 Font를 설정해 놓을수 있다.
* Font Name - 화면 Font 설정
* PDF Font Name - PDF Font 설정
* Line Spacing - 출력 위치
* Horizontally Align - Text Box에서 가로,세로 위치
* Vertically align - Text Box에서 높이 위치
* Rotation - 출력 각도
* PDF Encoding - PDF 인코딩
Posted by 1010
53.jasper&ireport2012. 1. 3. 13:37
반응형

출처 : http://dalyal.tistory.com/entry/iReport의-Elements

iReport에서는 선이나 네모,원, 텍스트박스등을 다 Elements란 개념으로 표현합니다.
각각의 Elements들은 상단에 존재하는 Toolbar를 이용하거나 Menu에 Edit부분을 보면
Insert Elements를 이용해서 삽입해 줄 수 있습니다
또 화면에 삽입한 Elements들은 아래의 그림과 같이 트리 형식으로 나타납니다.

사용자 삽입 이미지


-각 Elements에 대한
자세한 설명은
차차 하도록 하고
이런것이 있구나 하고
그냥 넘어가시면 됩니다.


-각 band에 위치하는 Elements는
tree형태로 존재하고 되고
상단에 위치하는 Elements일수록
화면 아래쪽에 위치합니다.


-마지막에 Filters부분이 있는데
이부분은 기본적으로 제공되는
Parameter와 Variables부분을
보여주나 안보여주나를 설정해
줍니다.


그리고 Elements는 화면에서
사용자 삽입 이미지
위치에 따라 에러가 나는 경우가 있습니다.


Elements의 테두리색을 보면 알수 있는데 3가지 색깔로 표현됩니다,
-파란색 : 가장 최적의 위치입니다,
-녹색 : 겹치는 Elements가 있는 경우입니다. 출력은 되지만 겹쳐서 나타납니다.
-빨강색 : 자신의 band를 벗어나는 경우입니다. 에러가 나고 출력되지 않습니다
(아래에서 위쪽 band로 이동시에는 에러가 나지 않지만 짤려서 나옵니다.)
최대한 파란색이 될 수있도록 해주시고 글자의 크기보다 Elements의 크기가 커야만
제대로된 출력물을 볼수 있습니다

그럼 다음으로는 Elements의 Common속성에 대해 알아 보겠습니다.
Common부분은 모든 Elements에서 공통으로 포함하고 있는 속성입니다.

사용자 삽입 이미지


*Band : 이 Elements가 위치한 band를 말합니다
*Top : 위치한 band의 최상단에서부터 떨어진 거리를 말합니다
*Left : 위치한 band의 좌단에서부터 떨어진 거리를 말합니다
*Width,Height : Elements의 넓이와 높이를 말합니다
*Foreground : Elements의 나타나는 값의 색깔을 말한다, Text라면 글자색을
선이라면 선의 색깔을 말합니다
*Background : Elements의 배경색을 말합니다
*Transparent : Background를 투명하게 채운다.(배경색 없어짐)
*Remove line when blank : 빈칸일때 그 줄을 지웁니다

그 외의 것은 사용해 보아도 뭐가 변하는지 잘 모르겠고 해서..
그냥 넘어가도록 하겠습니다. (죄송합니다)

그럼 다음장에서는 Element의 종류에 대해 알아보겠습니다.

Posted by 1010
53.jasper&ireport2012. 1. 3. 13:36
반응형

출처 : http://dalyal.tistory.com/entry/iReport의-구조properties

Report Properties는 보고서 생성시 보고서의 Page size나 출력할 방향, Page Margins 등의
여러가지 속성들을 설정 하는 창으로 Menu에서 File-New Document를 누르거나 툴바에서
흰색 종이모양을 클릭해 주시면 아래와 같은 보고서 속성 설정창을 볼 수 있을 것이다.

사용자 삽입 이미지

Report Name : 뭐 당연히 보고서의 파일명을 정하는 곳 입니다.
Preset sizes : pixel단위로 여러 종류의 표준 용지를 처리 할 수 있도록 지원 합니다.
Orientation : iReport의 표시 방향을 조정해 주는 것입니다.
- Portrait : 세로 방향
- Landscape : 가로 방향

그리고 아래 쪽 탭 부분에 대한 설명 입니다.

* Page Margin : Page의 상/하/좌/우의 여백을 조정합니다

* Columns : 보고서는 기본적으로 가로 방향으로 나뉘어져 있는데 간혹 세로방향으로
나눌때는 Columns값을 증가 시켜서 쓰면 됩니다.
(Columns의 수만큼 Width의 크기에 따라 레코드 값이 표시 됩니다)
사용자 삽입 이미지
(Columns 크기 변경시 예)

* Scriptlet Class : 보고서 생성시 새 페이지를 시작하거나 그룹의 끝 등에 다 달았을때
특별한 이벤트 처리를 하고자 할 때 scriptlet을 사용합니다.
옵션에 따라 사용을 원치 않으면 'Don't use scriptlet'을 선택 하거나
취향에 따라 옵션을 선택해 준다.
Language는 script의 표현식을 나타내기 위한 언어로 JAVA와
GROOVY를 지원한다.
솔찍히 이부분은 써보지 않아서 대략적인 의미만 알고 있다.
*More...
- Title on a new page : 보고서에 독립적인 Title 페이지를 추가해 출력한다
- Summaray on a new page : 위 옵션과 동일한데 Summary를 추가하는 것이다.
이 옵션을 체크 하면 만약 10장의 보고서 내용이 있다면
모두 11장의 보고서가 출력 된다
- Floating column footer : 이 옵션을 체크 해주면 Detail band 끝에 column footer가
연결되고 체크 안해주면 Page footer band위에 위치 한다.
- Ignore pagination : 체크시 전체페이지가 아닌 출력 부분만 보여준다.
- Print Order : 다중 column 출력 시 출력 방향을 설정한다.
- When no date : 만약 출력 데이터 값이 없을 때 출력 방법을 선택한다.
NoPages(출력없음) Blank Page(빈페이지 출력) AllSelectionNoDetail(Detail만 제외)
,No-data Section(No-data band부분의 내용을 출력) <- 가장 추천한다.

* i18n
- Format Factory Class
- Resource Bundle Base Name : 다국어를 지원하는 보고서 생성시 사용하는 Option
- When resource missing type : resource를 분실하거나 문제가 있을시 출력 방법
- XML encoding : XML 인코딩 방법을 선택한다.

오늘은 iReport의 Page속성에 대해 알아 보았습니다..
개인적으로 다른 리포트툴보다 기능이 적지만 충분이 쓸만하다고 생각합니다..(무료니깐..)
버전이 바뀌면서 점점 지원하는 것도 많아져서 몇달 지나지 않아
내가 작성한 메뉴얼은 쓸모가 없어 질지도 모르겠네요..

다음에는 iReport안에 들어갈 Element에 대해서 알아 보겠습니다..
Posted by 1010
53.jasper&ireport2012. 1. 3. 13:35
반응형

출처 : http://dalyal.tistory.com/entry/iReport의-구조band


band란 가로 방향으로 나뉘어 각각에 고유한 이름을 가지고 일정한 영역을 가지는 iReport의
화면을 나누는 개념입니다.

기본적으로 band는 Title, LastPaheFooter, Summary band를 제외하고 나머지 band들은
Detail band를 기준으로 상하로 구분되어 Header와 Footer로 구분되어 짝을 이루고 있습니다
각각의 band들은 특징을 가지는데 아래에서 그 특징을 알아보겠습니다.

1. Background band
- 보고서의 배경 설정을 할 수 있다.

2. Title band
- 가장 먼저 보여주는 band로 보고서 전체 페이지중 단 한번만 출력되는 band로 주로
보고서의 Title을 기재하는데 사용된다.

3. Page header band (Page footer band)
- 한번 정의되면 보고서 전체 페이지의 헤더 부분에 똑같은 위치와 크기로 페이지마다
반복 출력 된다.(Page footer band는 전체 페이지의 하단에 반복 출력된다.)

4. Column header band (Column footer band)
- 각 Detail band의 column 항목의 Title 영역으로 사용된다. 역시 페이지마다 출력 된다.

5. Group header band (Group footer band)
- 사용자가 임의로 만든 band로 0개 이상을 만들수 있다. Detail band 상하에 위치한다.

6. Detail band
- 가장 핵심이 되는 band. 다른 band에서도 Query를 이용해 수집된 데이터를 나열해
출력 할 수 있지만 detail에서는 한개 이상의 모든 Rows를 출력 할 수 있다.

7. Last Page Footer
- 다른 일반 footer와 다르게 보고서의 맨 마지막 페이지에만 결과를 나타내고자 할 때
사용하는 band로 Title band와 유사하게 딱 한번만 출력 된다.

8. Summary band
- 보고서 전체 페이지중에 맨 마지막 페이지에 출력되는 band로 주로 총 합계 등을
나타내고자 할 때 사용 한다.

사용자 삽입 이미지

iReport band

Posted by 1010
53.jasper&ireport2012. 1. 3. 13:35
반응형

출처 : http://dalyal.tistory.com/entry/iReport-준비단계Options-Setting

이번 단계에서는 iReport사용에 대해 전반적인 설정을 해보겠습니다.

iReport를 실행시키고 위에 메뉴바에 보면 Options에서 Settings..를 클릭합니다.
그럼 밑에 보이는 그림과 같은 Options창이 뜹니다.

사용자 삽입 이미지


1. General

iReport에 대한 기본적인 Option을 선택해 주는 부분이다.
이부분은 저도 그냥 그대로 썼습니다.

2. Compiler

iReport의 Compile에 대한 Option을 정해주는 부분인데 Dafault compilation directory에
자신의 컴파일하거나 실행한 파일들을 저장해 줍니다.
(ex : *.jasper(컴파일시) , *.pdf , *.excel 등등)

사용자 삽입 이미지


참고로 저는 iReport 폴더 안에 compile이란 새폴더를 만들어서 거기에 저장을 했습니다.

3. Backup

저장시 백업에 대한 option을 선택해 주는 부분입니다.
- No Backup : 말그래도 백업 안하는거죠
- Replace Extension with .bak : 파일명에 확장자가 bak으로 저장됩니다. (xxx.bak)
- Append .bak to existing extension : 파일명.jasper에 bak이 붙습니다. (xxx.jasper.bak)

사용자 삽입 이미지


4. External Programs

이 부분은 출력시 나타낼 수 있는 Viewer들을 연결해 주는 부분입니다.
저는 PDF랑 HTML이랑 XLS부분만 연결했습니다.
연결방법은 그냥 Browse를 선택해서 연결해 주면 됩니다.

사용자 삽입 이미지


위에 External Editor는 외부 에디터 프로그램을 연결하는거 같은데..
해보지 않아서 잘 모르겠습니다.

우선 여기까지만 해주셨다면 iReport의 기본적인 준비 단계는 완료 되었습니다.
다양한 출력방식중에서 하나를 고르실때는 상단 메뉴바에서 Build 를 클릭후에
나오는 것들 중에 하나를 고르시면 됩니다. 그중 JRViewer는 기본적으로 제공되는
preview로 jasper파일 이외에 실행 파일은 남기지 않습니다.
다른 preview선택시 예를들어 PDF preview를 선택하셨다면 실행후 아까 설정하신
저장 폴더에 PDF파일이 저장이 됩니다.

다음장부터는 iReport 화면에 대해 알아보겠습니다.

Posted by 1010
53.jasper&ireport2012. 1. 3. 13:34
반응형

출처 : http://dalyal.tistory.com/entry/iReport-준비단계Database연결하기

iReport는 default로 MySQL을 지원합니다.
저는 Oracle을 쓰기 때문에 따로 Oracle드라이버를 추가 시켜주었습니다.

사용자 삽입 이미지


저처럼 따로 LIB를 만들어 주신다면 그쪽에도 추가 시켜주어야 합니다.

자. jar파일을 추가 해 주셨다면 다음은 iReport 화면으로 돌아갑니다.
상단 메뉴바에서 Data - Connections/Data Source를 클릭하거나
Toolbar 2번째 줄 맨끝에 있는 원통에 플러그 꼽는 아이콘을 클릭합니다(;;)

그러면 다음과 같은 화면이 나옵니다.
사용자 삽입 이미지


여기서 NEW를 클릭하게 되면 datasource type을 고르라고 하는데
Database JDBC connection을 선택하고 NEXT를 클릭 합니다. (다른것은 안해봣음;;)

자 이제 Connections properties란 창이 하나뜨는게 보이네요.
여기서 자신이 연결한 Database에 대한 설정을 해줍니다.

* Name - 앞으로 표시 될 이 Database의 이름을 말합니다.
* JDBC Driver - 전 오라클 사용을 위해 oracle.jdbc.driver.OracleDriver를 선택합니다.
* JDBC URL - 이부분은 직접 써넣어도 되지만 자동 세팅 할수 있기 때문에 스킵합니다.
* Server Address - 자신이 연결한 Database의 주소를 써줍니다 (ex. 192.68.41.1)
* Database - 자신이 연결한 Database의 이름을 써줍니다.(ex: ora92)
=> 주소와 Database 이름 써넣은후 Wizard를 클릭하면 URL이 세팅 됩니다.
* User Name - Database 연결 하는 User ID를 말합니다.
* Password - Database 연결 하는 비밀번호를 말합니다.
(Save password를 체크 하지 않으면 Database 연결시 마다 비번를 입력해야 합니다.)

자 다 설정 하셨으면 Test버튼을 클릭해서 Connection test successful!이 뜨면
제대로 연결이 된것 입니다.
Save 하면 추가된 Datasource를 확인 할수 있습니다.
여러개를 추가할 수 있고 그 중 하나를 Default로 지정해야 합니다
(따로 Default를 지정하지 않으면 가장 마지막에 만든 Datasource가 default가 됩니다.)

이로써 iReport에 Database를 연결하는 방법은 끝났습니다.
다음 장에서는 여러 Option들에 대해 알아보겠습니다.

Posted by 1010
53.jasper&ireport2012. 1. 3. 13:33
반응형
출처 : http://dalyal.tistory.com/entry/iReport-준비단계

iReport를 사용하기 위해서는 자신의 jdk-lib 안에 있는 jar파일(dt.jar , tools.jar)과
한국어를 사용하기 위해서 iTextAsian.jar를 Classpath에 추가해 줘야 합니다.
(iTextAsian.jar는 맨 밑에 첨부 파일로 올렸습니다)


사용자 삽입 이미지


제가 쓰는 환경에 맞게 Weblogic(웹서버)에서 제공하는 JDK을 이용하였고
Weblogic에서 iReport를 사용하기 위해서 임의로 ireport-lib라는 폴더를 새로만들어
폴더 안에 iReport의 library들과 함께 iTextAsian를 추가 했습니다.

Posted by 1010
53.jasper&ireport2012. 1. 3. 13:32
반응형
출처 : http://dalyal.tistory.com/entry/OpenSource-Report-작성tool-인-iReport

회사에서 진행하는 프로젝트에 사용하게 된 리포트툴입니다.
깔끔한 UI와 오픈소스로 무료배포인게 가장 큰 매력이었구요..
국내에 제대로 된 자료를 찾기 어려워서(버전이 낮은 것은 있더군요.)
직접 익힌 iReport 사용법을 소개하고자 합니다.
사용한 버전이 1.3.1 이지만 최근에 릴리즈된 2.0.1버전이랑 별 차이가 없어서
사용했던 버전에 2.0.1버전에 추가한 내용을 합해서 설명하겠습니다.

iReport 를 사용하기 위해서는 Sun Java 2 SDK 1.5 이상의 버전과
Runtime Environment (JRE) 필요하고 jasper 파일을 컴파일 하기 위해서는
Java 2(JDK)가 필요합니다.

우선은 아래 링크를 따라가서 iReport를 다운 받습니다.

http://sourceforge.net/projects/ireport/
2007년9월12일 현재 가장 최근에 릴리즈된 버전이 2.0.1버전 이네요
파일명 : iReport-2.0.1.tar.gz

적당한 위치에 다운 받으시면 됩니다.(전 그냥 바탕화면에 다운 받았습니다)
1.3 대 버전때는 인스톨을 해야 했는데
2.0 대 버전으로 넘어오면서는 인스톨 하지않고 실행이 되더군요.

자 여기까지 제대로 하셨다면 iReport 로딩 화면(분홍색꽃무늬) 보실수 있을겁니다.

사용자 삽입 이미지


Posted by 1010