반응형
'ireport'에 해당되는 글 8건
- 2012.02.06 jreports.pdf
- 2012.02.02 Creating Jasper subreports via iReport with multilple java beans 1
- 2012.01.03 iReport의 Parameter, Field, Variable
- 2012.01.03 iReport의 Elements 종류(2/2) 1
- 2012.01.03 iReport의 Elements 종류(1/2)
- 2012.01.03 iReport의 구조(properties)
- 2012.01.03 iReport - 준비단계(Options-Setting)
- 2012.01.03 리포트 작성툴 인 iReport
53.jasper&ireport2012. 2. 6. 18:20
 jreports.pdf
53.jasper&ireport2012. 2. 2. 14:16
반응형
Simple Guide To Sub-reports in JasperReports / iReport
Reporting tools… why is it so hard??
It seems like it’s practically a requirement that all business reporting tools be difficult to learn, use and work with. JasperReports / iReport is no different. Don’t get me wrong it’s a good solution to a certain kind of problem (and it’s free and open source which doesn’t hurt), but the iReport UI is (and I’ll try to be kind) utilitarian at best.
Anyhow, to do any non-trivial report with iReport, you’ll probably need to use sub-reports, which are not very clearly documented as to how the hell they work.
I’ll be talking strictly about Java-bean collection data sources for this article, so you will need to translate if you are doing direct SQL queries or something else.
The Java-bean data source is nice because we can utilise our existing domain layer in order to create our report, rather than replicating the same logistics in SQL (or worse – stored procedures) and thereby having two places to update when requirements change.
To easily understand how sub-reports work, we need to understand how JasperReports works in general.
JasperReports are stored in XML files (JRXML) – if you’ve created any report you’d be familiar with these files. These XML files are translated to Java source code by JasperReports, and then compiled into regular Java CLASS files, which are executable by the Jasper engine. You could say that Jasper compiles the JRXML files into Java, and then Java will compile these into byte code.
When you execute a report you are essentially executing Java code. Keep this in mind when filling out expression fields in your report, and things will start to make more sense.
Generally you use a sub-report in a situation where you have a two or more child lists of data relating to a single parent element. A common use case would be a report with multiple details bands of different types. I say “different types”, because if you have nested children that relate to the same data set, then generally you can achieve formatting using groups with breaking on certain fields in the data set. Things get complicated though where you have one big report, which has multiple unrelated data sets inside it.
To avoid getting too meta – here’s a concrete example…

This report has a single main detail band (contact details – first and last names) and two sub-detail bands for each contact – addresses and phone numbers.
In Jasper we need to use two sub-reports to implement this. But before we get too far, let’s look at how we would create Javabeans to store this data.
The addresses:
package com.visural.report;


public class AddressBean {


    private String type;


    private String address;


    public String getAddress() {


        return address;


    }


    public void setAddress(String address) {


        this.address = address;


    }


    public String getType() {


        return type;


    }


    public void setType(String type) {


        this.type = type;


    }


}
The phone numbers:
package com.visural.report;


public class PhoneBean {


    private String type;


    private String number;


    public String getNumber() {


        return number;


    }


    public void setNumber(String number) {


        this.number = number;


    }


    public String getType() {


        return type;


    }


    public void setType(String type) {


        this.type = type;


    }


}
And the contact (parent) bean:
package com.visural.report;
import java.util.List;
public class ContactBean {
private String firstName;
private String lastName;
private Listaddresses;
private Listphones;
public ListgetAddresses() {
return addresses;
}
public void setAddresses(Listaddresses) {
this.addresses = addresses;
}
public String getFirstName() {
return firstName;
}
public void setFirstName(String firstName) {
this.firstName = firstName;
}
public String getLastName() {
return lastName;
}
public void setLastName(String lastName) {
this.lastName = lastName;
}
public ListgetPhones() {
return phones;
}
public void setPhones(Listphones) {
this.phones = phones;
}
}
Finally, we need a test data source to use in developing our report. Here’s the factory for the report pictured earlier…
package com.visural.report;
import java.util.Arrays;
import java.util.List;
public class ContactFactory {
public static Listcreate() {
ContactBean stub = new ContactBean();
stub.setFirstName("John");
stub.setLastName("Smith");
AddressBean address1 = new AddressBean();
address1.setType("Home");
address1.setAddress("123 Fake St\nFaketown\nFK 12345");
AddressBean address2 = new AddressBean();
address2.setType("Work");
address2.setAddress("321 Bogus St\nFaketown\nFK 12345");
stub.setAddresses(Arrays.asList(address1, address2));
PhoneBean phone1 = new PhoneBean();
phone1.setType("Home");
phone1.setNumber("03 9876 1234");
PhoneBean phone2 = new PhoneBean();
phone2.setType("Work");
phone2.setNumber("03 1234 9876");
PhoneBean phone3 = new PhoneBean();
phone3.setType("Mobile");
phone3.setNumber("0432 123 456");
stub.setPhones(Arrays.asList(phone1, phone2, phone3));
return Arrays.asList(stub);
}
}
The thing to notice here is that we have modelled the Javabeans exactly as we would if they were being used for some other purpose, i.e. we haven’t done anything special to make them usable in JasperReports / iReport.
In Jasper we configure a Javabeans data source that is created from a Collection, using our ContactFactory.create() method. We then add fields as follows, and create our report layout:

Note that the field names correspond to the Javabean property names.
Now for the important part. We then need to set the data source on the sub-report’s properties:


So we can just use an “data source expression” as our connection for the sub-report, and for the expression we create a data source on the fly using our collection of java beans from our current data source’s “addresses” and “phones” fields. “new net.sf.jasperreports.engine.data.JRBeanCollectionDataSource(datasource.getPhones())” is the Java code we would write if we were to create a Javabean data source in our regular Java code. JasperReports will replace $F{phones} with “datasource.getPhones()” (or its equivalent) as part of it’s JRXML to Java compilation process.
The rest is simple; our sub-reports define fields that match the AddressBean and PhoneBean properties:


With all that in mind, it really is a case of “it’s simple when you know how”, but be that as it may, I couldn’t find a concise description of how to do this in my googling. Hopefully this post will fill that gap. Perhaps everyone is still writing SQL-based reports against a single database? ![]() I don’t know, but using Javabeans is a nice flexible alternative to use SQL-based reports that gives you a lot of options in the long term.
I don’t know, but using Javabeans is a nice flexible alternative to use SQL-based reports that gives you a lot of options in the long term.
If you’re still confused you can download the above code, and the JRXML reports in a Netbeans 6 project here.
Also, try one of these books. Jasper & iReport’s documentation is pretty thin online, so having a reference book can be handy –
53.jasper&ireport2012. 1. 3. 13:39
반응형
출처 : http://dalyal.tistory.com/entry/iReport의-Field-Parameter-Variable
이번에 알아볼것은 iReport에서 핵심을 이루고 있는 Text Field에 들어가는 것들 입니다.
DB에서 값을 가져오는 Field, 조건이나 가지고 있는 값 자체를 사용 할때 쓰는 Parameter,
Count나 Sum 등 연산에 자주사용되는 Variable 에 대해 알아 보겠습니다.
Document structure 부분입니다.
iReport에서 Default로 제공하는 부분을
빼고 (젤 아래부분 Filters에서 유무조절)
개발자가 작성한 부분만 표시되고 있습니다.
SUBREPORT_DIR은 subreport의 경로를
담고 있으며 연결에 사용됩니다
RCIV_DATE,RCIV_SEQ는 쿼리를 날려
얻어온 컬럼명입니다.
Variables는 얻어온 RCIV_SEQ의 합계를
얻기 위해 만든 변수입니다.
1. Parameters
- 실행시 외부에서 동적으로 Data를 받아오거나 Report끼리(특히 Subreport쓸떄) Data를
주고 받을때 사용됩니다. 자체적으로 제공하는 Parameter도 있습니다.
표기 형식은 $P{<parameter명>}이고 원하는 타입을 직접 설정해 줄 수 있습니다.
Use as a Prompt 부분에 체크를 해주면 실행시 Parameter값을 입력하는 창이 뜹니다.
Default Value Expression부분에는 Parameter값을 써줄수 있는데 값을 써줄때 그냥 값을
넣는게 아니라 위 그림처럼 그 타입에 맞게 생성해 주어야 한다.
2. Fields
표기 형식은 $F{<column명>}이고 Type은 DB의 Table에 따릅니다.
3. Variables
사용합니다.
표기 형식은 $V{<variables name>} 이고 원하는 타입을 직접 설정해 줍니다.
Variable Expression에 값을 넣을수 있는데 Parameter에서 처럼 new BigDecimal(10)처럼
생성해주거나 위 그림 처럼 Fields을 써넣을 수도 있습니다.
그림을 보면 우측에 Variables속성 창에 Calculation Type' Option이 있는데
이 Option은 iReport에 내장되어 있는 내장 함수를 이용할 것인지를 선택하는 항목입니다.
만일 원치 않으면 'Nothing'을 선택하면 됩니다
* 내장함수 List:
Count - 입력 값의 수량 반환
Distinct Count - 입력 값의 수량 반환(중복x)
Sum - 입력 값의 합 반환
Average - 입력 값의 평균 반환
Lowest - 입력 값 중 가장 작은 값 반환
Highest - 입력 값 중 가장 큰 값 반환
Standard Deviation - 입력 값의 표준편차 반환
Variance - 입력 값 중 평방편차 반환
System - 연산에 사용되지 않지만 Memory에서 맨 마지막에 사용된 값을 반환
First - 맨 처음에 사용된 값을 반환
53.jasper&ireport2012. 1. 3. 13:39
반응형
출처 : http://dalyal.tistory.com/entry/iReport의-Elements-종류22
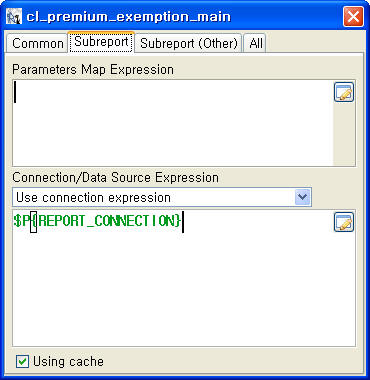 * Subreport Connection방법인데 전 그냥 Default로 제공되는 방법을 이용했습니다.
(Mainreport랑 같은 방법으로 접속하는 방법)
* Mainreport에 Subreport를 연결하는 방법은 앞 장에서 본 Image연결과 비슷합니다
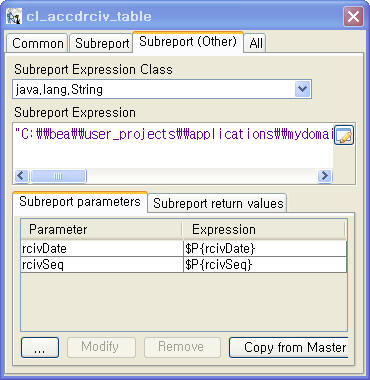
* Subreport Expression Class 에서 Type을 설정하고 밑부분에 주소를 써줍니다.
- java.lang.String - "C:\\bea\\(주소~~).jasper" <- Subreport 경로써줌
- java.io.File - new File(System.getProperty("config.dir") + "/(주소~).jasper")
<- 파일위치에 경로를 찾아가는 방식
* Subreport parameters 부분은 Main에서 Sub로 값을 넘길때 사용합니다
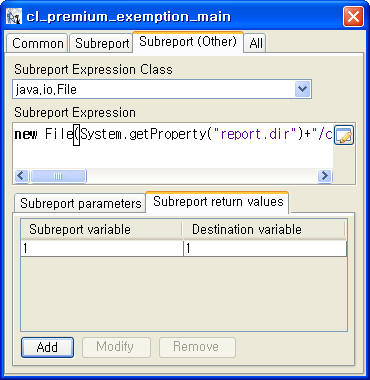
* Subreport return values는 Sub에서 Main으로 값을 넘길떄 사용하는데
Subreport Variable은 Subreport쪽에 만드는 것이고 Destination variable은
Mainreport 쪽에 만들어 놓는 것이다. 두 군데 모두 변수가 만들어져 있어야 가능하고
이부분은 Subreport의 컬럼 수나 함계, 통계등 변수값을 쓸때 사용합니다.
7. Chart - iReport에서는 보고서에 나타낼 수 있는 여러종류의 Chart를 지원하고
Edit / InsertElement / chart 나 Toolbar에서 찾아 클릭해 드래그 하면 됩니다.
바로 그래픽을 선택하는 부분이 나오고 Properties에서 기타 설정을 해줍니다
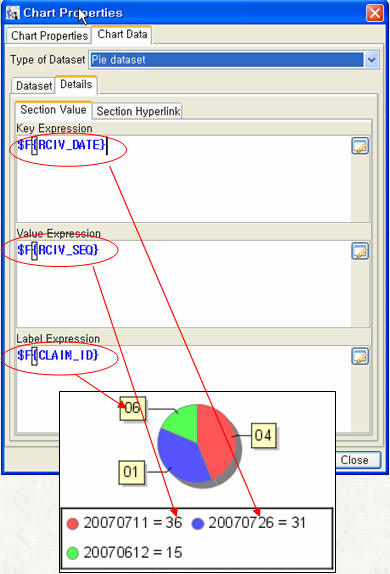
* 위 그림은 Chart부분에서 pie 모양 Chart에서 어디 위치에 값이 나오는지 보여주기 위해
예로 만든 Chart입니다.
8. Barcode tool - 값을 바코드 형식으로 보여주고 출력합니다.
바코드 인식기계에 그 값이 나타납니다.
9. Frame - iReport에 Frame을 나누어 줄때 씁니다.
10. Crosstab - 표 형식으로 여러 값을 출력 할 때 유용하게 사용할 수 있습니다.
11. Hyper Link - iReport에서는 HypeLink를 허용합니다. Static text와 graphic Element를
제외한 Elements에서 모두 설정 할 수 있습니다.
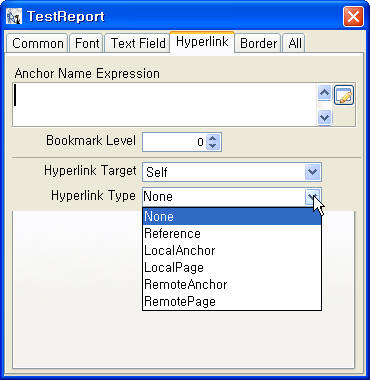
* Hyperlink Type
1.None - 링크가 없는 상태
2.Reference - Website로 link
ex)”http://www.naver.com”
3. LocalAnchor - 보고서 내부 특정band로 link
ex)”summary”
4.LocalPage - 보고서 내부의 특정page로 link
ex)new Integer(4)
5. RemoteAnchor - 다른 파일 band로 link
6. RemotePage - 다른 파일 특정 page로 link
=> Hyperlink는 PDF에서는 잘 되지 않았고 explore에서 실행해 보았습니다.
6. Subreport - Mainreport 안에 다른 보고서를 포함하는 것으로 각 보고서간에
서로 Parameter를 주고 받을 수 있고 독립적으로 서로 다른 보고서 결과를
(한마디로 다른 쿼리) 작성할 때 사용합니다.
* Edit / InsertElement / Subreport 를 클릭하거나 Toolbar에서 아이콘을 클릭해서
Mainreport안에 만들어 준다. ( 이때 크기는 Subreport크기랑 맞추어 주는 걸 추천한다)
(Mainreport랑 같은 방법으로 접속하는 방법)
* Mainreport에 Subreport를 연결하는 방법은 앞 장에서 본 Image연결과 비슷합니다
* Subreport Expression Class 에서 Type을 설정하고 밑부분에 주소를 써줍니다.
- java.lang.String - "C:\\bea\\(주소~~).jasper" <- Subreport 경로써줌
- java.io.File - new File(System.getProperty("config.dir") + "/(주소~).jasper")
<- 파일위치에 경로를 찾아가는 방식
* Subreport parameters 부분은 Main에서 Sub로 값을 넘길때 사용합니다
* Subreport return values는 Sub에서 Main으로 값을 넘길떄 사용하는데
Subreport Variable은 Subreport쪽에 만드는 것이고 Destination variable은
Mainreport 쪽에 만들어 놓는 것이다. 두 군데 모두 변수가 만들어져 있어야 가능하고
이부분은 Subreport의 컬럼 수나 함계, 통계등 변수값을 쓸때 사용합니다.
7. Chart - iReport에서는 보고서에 나타낼 수 있는 여러종류의 Chart를 지원하고
Edit / InsertElement / chart 나 Toolbar에서 찾아 클릭해 드래그 하면 됩니다.
바로 그래픽을 선택하는 부분이 나오고 Properties에서 기타 설정을 해줍니다
* 위 그림은 Chart부분에서 pie 모양 Chart에서 어디 위치에 값이 나오는지 보여주기 위해
예로 만든 Chart입니다.
8. Barcode tool - 값을 바코드 형식으로 보여주고 출력합니다.
바코드 인식기계에 그 값이 나타납니다.
9. Frame - iReport에 Frame을 나누어 줄때 씁니다.
10. Crosstab - 표 형식으로 여러 값을 출력 할 때 유용하게 사용할 수 있습니다.
11. Hyper Link - iReport에서는 HypeLink를 허용합니다. Static text와 graphic Element를
제외한 Elements에서 모두 설정 할 수 있습니다.
* Hyperlink Type
1.None - 링크가 없는 상태
2.Reference - Website로 link
ex)”http://www.naver.com”
3. LocalAnchor - 보고서 내부 특정band로 link
ex)”summary”
4.LocalPage - 보고서 내부의 특정page로 link
ex)new Integer(4)
5. RemoteAnchor - 다른 파일 band로 link
6. RemotePage - 다른 파일 특정 page로 link
=> Hyperlink는 PDF에서는 잘 되지 않았고 explore에서 실행해 보았습니다.
53.jasper&ireport2012. 1. 3. 13:38
반응형
출처 : http://dalyal.tistory.com/entry/iReport의-Elements-종류
iReport의 Elements 종류로는 선,사각형,타원,이미지삽입,텍스트 등이 있고.
그 외의 것들로 subReport, Chart, Barcode tool, Frame, Crosstab 등이 존재합니다.
'>iReport상단에 Menu아래에 존재하고 위에 그림처럼 직관적으로 잘나타나져 있습니다
1. 선
선을 나타낸다. Line Direction 옵션에서 Top-down(기본값) ,Bottom-up의 두가지 모양이
있는데 두가지는 각기 우측상단에서 좌측하단으로 좌측상단에서 우측하단으로의 모양을
가지고 있습니다.(높이를 0으로 해주면 직선이 됩니다)
또 Graphics Element옵션에서 Pen 속성값으로 굵기를 선택해줍니다(Dotted는 점선)
2. 사각형
사각형을 표현할 때 사용된다. 다른 iReport 메뉴얼이나 작성법을 보면 Layout를 나눌때
많이 사용한다고 합니다.
또 사각형Element는 Rectangle에서 Rectangle radius라는 옵션이 있다. 0일때는
그냥 사각형이고 숫자값이 커질수록 사각형 모서리 부분이 뭉퉁하게 됩니다.(타원이 됨)
3. 타원
별다른 옵션이 없다. 그냥 타원입니다..
4. 이미지
보고서에 사진이나 이미지를 추가할때 사용합니다. Image Expression부분에 이미지 경로와
파일명을 적어주면 되는데 지원타입으로는 gif,jpeg등 다양합니다.
이미지경로를 작성하는 방법으로는 Image Expression Class 부분에서 Type을 정해주는데
저는 String이랑 File 방법을 사용해 보았습니다
java.lang.String - "C:\\이미지.jpeg" <- 경로써줌
java.io.File - new File(System.getProperty("config.dir") + "/이미지.jpeg")
<- 파일위치에 경로를 찾아가는 방식
그 외에 다른 방법은 직접 사용해 보면서 익히길 바랍니다..
5. 텍스트
iReport를 하면서 가장 많이 사용하는 부분이다. iReport에 사용하는 텍스트는 2가지 종류가
있고 그외의 옵션에 대해서도 알아 보겠습니다.
1)Static Text - 문자를 단순히 표현하는 Elements
2)Text Field - DB에서 추출된 Field값이나 Parameter 나 Variables을 표현하는 Elements
Text Field Expression Class에서 문자의 Type을 정해줄수 있습니다
Evaluation Time와 Group옵션에 대해서는 잘 모르겠던데
아시는 분 있으면 댓글 좀 달아주시면 감사하겠습니다..
Stretch with overflow - Elements 의 길이가 넘었는데도 값이 남아있다면
다음줄에 값이 나타난다.
Blank when null - 값이 null일 때는 빈칸으로 나타내어 준다.
Pattern - 날짜나 숫자값일때 표현패턴을 지정해 준다 (ex) ##.# -> 32.2
Text Field Expression - 표현할 값을 적어준다 ($F{} , $P{}, $V{} 등등)
* Border옵션 - Padding - Element Box와 문자 사이에 거리를 설정해준다.
Border - Element Box의 선을 편집해 준다
( 저는 이런 방식으로 보고서에 줄과 칸을 나눕니다. )
* 기타 Text옵션 - 굵게(Bold),이태리체(italic),밑줄(Underline)등 제공하는 옵션들이 있다.
정렬의 위치와 Element Box에서의 위치도 조절 할 수 있다.
* Static Text와 Text Field 둘다 F2로 편집이 가능하고 Static Text는 F3키로 편집이 가능한데
이떄 Text Field로 변환이 되어 버리니 조심해야 한다.
* Font - iReport는 여러 종류의 Font를 지원하고 외부 Font(TTF)는 classpath설정을 통해
할수 있다.
보고서를 PDF형식으로 생성을 한다면 PDF 보고서를 위한 Font설정도 해주어야 함
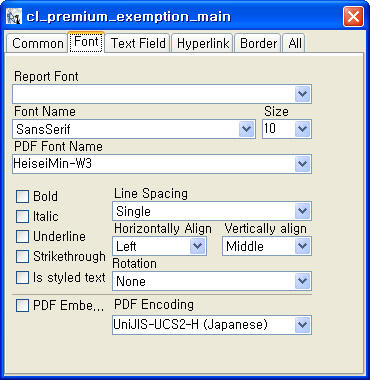
* Report Font - Menu/ Format /Fonts를 클릭하면 원하는 Font를 설정해 놓을수 있다.
* Font Name - 화면 Font 설정
* PDF Font Name - PDF Font 설정
* Line Spacing - 출력 위치
* Horizontally Align - Text Box에서 가로,세로 위치
* Vertically align - Text Box에서 높이 위치
* Rotation - 출력 각도
* PDF Encoding - PDF 인코딩
iReport의 Elements 종류로는 선,사각형,타원,이미지삽입,텍스트 등이 있고.
그 외의 것들로 subReport, Chart, Barcode tool, Frame, Crosstab 등이 존재합니다.
'>iReport상단에 Menu아래에 존재하고 위에 그림처럼 직관적으로 잘나타나져 있습니다
1. 선
선을 나타낸다. Line Direction 옵션에서 Top-down(기본값) ,Bottom-up의 두가지 모양이
있는데 두가지는 각기 우측상단에서 좌측하단으로 좌측상단에서 우측하단으로의 모양을
가지고 있습니다.(높이를 0으로 해주면 직선이 됩니다)
또 Graphics Element옵션에서 Pen 속성값으로 굵기를 선택해줍니다(Dotted는 점선)
2. 사각형
사각형을 표현할 때 사용된다. 다른 iReport 메뉴얼이나 작성법을 보면 Layout를 나눌때
많이 사용한다고 합니다.
또 사각형Element는 Rectangle에서 Rectangle radius라는 옵션이 있다. 0일때는
그냥 사각형이고 숫자값이 커질수록 사각형 모서리 부분이 뭉퉁하게 됩니다.(타원이 됨)
3. 타원
별다른 옵션이 없다. 그냥 타원입니다..
4. 이미지
보고서에 사진이나 이미지를 추가할때 사용합니다. Image Expression부분에 이미지 경로와
파일명을 적어주면 되는데 지원타입으로는 gif,jpeg등 다양합니다.
이미지경로를 작성하는 방법으로는 Image Expression Class 부분에서 Type을 정해주는데
저는 String이랑 File 방법을 사용해 보았습니다
java.lang.String - "C:\\이미지.jpeg" <- 경로써줌
java.io.File - new File(System.getProperty("config.dir") + "/이미지.jpeg")
<- 파일위치에 경로를 찾아가는 방식
그 외에 다른 방법은 직접 사용해 보면서 익히길 바랍니다..
5. 텍스트
iReport를 하면서 가장 많이 사용하는 부분이다. iReport에 사용하는 텍스트는 2가지 종류가
있고 그외의 옵션에 대해서도 알아 보겠습니다.
1)Static Text - 문자를 단순히 표현하는 Elements
2)Text Field - DB에서 추출된 Field값이나 Parameter 나 Variables을 표현하는 Elements
Text Field Expression Class에서 문자의 Type을 정해줄수 있습니다
Evaluation Time와 Group옵션에 대해서는 잘 모르겠던데
아시는 분 있으면 댓글 좀 달아주시면 감사하겠습니다..
Stretch with overflow - Elements 의 길이가 넘었는데도 값이 남아있다면
다음줄에 값이 나타난다.
Blank when null - 값이 null일 때는 빈칸으로 나타내어 준다.
Pattern - 날짜나 숫자값일때 표현패턴을 지정해 준다 (ex) ##.# -> 32.2
Text Field Expression - 표현할 값을 적어준다 ($F{} , $P{}, $V{} 등등)
* Border옵션 - Padding - Element Box와 문자 사이에 거리를 설정해준다.
Border - Element Box의 선을 편집해 준다
( 저는 이런 방식으로 보고서에 줄과 칸을 나눕니다. )
* 기타 Text옵션 - 굵게(Bold),이태리체(italic),밑줄(Underline)등 제공하는 옵션들이 있다.
정렬의 위치와 Element Box에서의 위치도 조절 할 수 있다.
* Static Text와 Text Field 둘다 F2로 편집이 가능하고 Static Text는 F3키로 편집이 가능한데
이떄 Text Field로 변환이 되어 버리니 조심해야 한다.
* Font - iReport는 여러 종류의 Font를 지원하고 외부 Font(TTF)는 classpath설정을 통해
할수 있다.
보고서를 PDF형식으로 생성을 한다면 PDF 보고서를 위한 Font설정도 해주어야 함
* Report Font - Menu/ Format /Fonts를 클릭하면 원하는 Font를 설정해 놓을수 있다.
* Font Name - 화면 Font 설정
* PDF Font Name - PDF Font 설정
* Line Spacing - 출력 위치
* Horizontally Align - Text Box에서 가로,세로 위치
* Vertically align - Text Box에서 높이 위치
* Rotation - 출력 각도
* PDF Encoding - PDF 인코딩
53.jasper&ireport2012. 1. 3. 13:36
반응형
출처 : http://dalyal.tistory.com/entry/iReport의-구조properties
Report Properties는 보고서 생성시 보고서의 Page size나 출력할 방향, Page Margins 등의
여러가지 속성들을 설정 하는 창으로 Menu에서 File-New Document를 누르거나 툴바에서
흰색 종이모양을 클릭해 주시면 아래와 같은 보고서 속성 설정창을 볼 수 있을 것이다.
Report Name : 뭐 당연히 보고서의 파일명을 정하는 곳 입니다.
Preset sizes : pixel단위로 여러 종류의 표준 용지를 처리 할 수 있도록 지원 합니다.
Orientation : iReport의 표시 방향을 조정해 주는 것입니다.
- Portrait : 세로 방향
- Landscape : 가로 방향
그리고 아래 쪽 탭 부분에 대한 설명 입니다.
* Page Margin : Page의 상/하/좌/우의 여백을 조정합니다
* Columns : 보고서는 기본적으로 가로 방향으로 나뉘어져 있는데 간혹 세로방향으로
나눌때는 Columns값을 증가 시켜서 쓰면 됩니다.
(Columns의 수만큼 Width의 크기에 따라 레코드 값이 표시 됩니다)
* Scriptlet Class : 보고서 생성시 새 페이지를 시작하거나 그룹의 끝 등에 다 달았을때
특별한 이벤트 처리를 하고자 할 때 scriptlet을 사용합니다.
옵션에 따라 사용을 원치 않으면 'Don't use scriptlet'을 선택 하거나
취향에 따라 옵션을 선택해 준다.
Language는 script의 표현식을 나타내기 위한 언어로 JAVA와
GROOVY를 지원한다.
솔찍히 이부분은 써보지 않아서 대략적인 의미만 알고 있다.
*More...
- Title on a new page : 보고서에 독립적인 Title 페이지를 추가해 출력한다
- Summaray on a new page : 위 옵션과 동일한데 Summary를 추가하는 것이다.
이 옵션을 체크 하면 만약 10장의 보고서 내용이 있다면
모두 11장의 보고서가 출력 된다
- Floating column footer : 이 옵션을 체크 해주면 Detail band 끝에 column footer가
연결되고 체크 안해주면 Page footer band위에 위치 한다.
- Ignore pagination : 체크시 전체페이지가 아닌 출력 부분만 보여준다.
- Print Order : 다중 column 출력 시 출력 방향을 설정한다.
- When no date : 만약 출력 데이터 값이 없을 때 출력 방법을 선택한다.
NoPages(출력없음) Blank Page(빈페이지 출력) AllSelectionNoDetail(Detail만 제외)
,No-data Section(No-data band부분의 내용을 출력) <- 가장 추천한다.
* i18n
- Format Factory Class
- Resource Bundle Base Name : 다국어를 지원하는 보고서 생성시 사용하는 Option
- When resource missing type : resource를 분실하거나 문제가 있을시 출력 방법
- XML encoding : XML 인코딩 방법을 선택한다.
오늘은 iReport의 Page속성에 대해 알아 보았습니다..
개인적으로 다른 리포트툴보다 기능이 적지만 충분이 쓸만하다고 생각합니다..(무료니깐..)
버전이 바뀌면서 점점 지원하는 것도 많아져서 몇달 지나지 않아
내가 작성한 메뉴얼은 쓸모가 없어 질지도 모르겠네요..
다음에는 iReport안에 들어갈 Element에 대해서 알아 보겠습니다..
53.jasper&ireport2012. 1. 3. 13:35
반응형
출처 : http://dalyal.tistory.com/entry/iReport-준비단계Options-Setting
이번 단계에서는 iReport사용에 대해 전반적인 설정을 해보겠습니다.
iReport를 실행시키고 위에 메뉴바에 보면 Options에서 Settings..를 클릭합니다.
그럼 밑에 보이는 그림과 같은 Options창이 뜹니다.
1. General
iReport에 대한 기본적인 Option을 선택해 주는 부분이다.
이부분은 저도 그냥 그대로 썼습니다.
2. Compiler
iReport의 Compile에 대한 Option을 정해주는 부분인데 Dafault compilation directory에
자신의 컴파일하거나 실행한 파일들을 저장해 줍니다.
(ex : *.jasper(컴파일시) , *.pdf , *.excel 등등)
참고로 저는 iReport 폴더 안에 compile이란 새폴더를 만들어서 거기에 저장을 했습니다.
3. Backup
저장시 백업에 대한 option을 선택해 주는 부분입니다.
- No Backup : 말그래도 백업 안하는거죠
- Replace Extension with .bak : 파일명에 확장자가 bak으로 저장됩니다. (xxx.bak)
- Append .bak to existing extension : 파일명.jasper에 bak이 붙습니다. (xxx.jasper.bak)
4. External Programs
이 부분은 출력시 나타낼 수 있는 Viewer들을 연결해 주는 부분입니다.
저는 PDF랑 HTML이랑 XLS부분만 연결했습니다.
연결방법은 그냥 Browse를 선택해서 연결해 주면 됩니다.
위에 External Editor는 외부 에디터 프로그램을 연결하는거 같은데..
해보지 않아서 잘 모르겠습니다.
우선 여기까지만 해주셨다면 iReport의 기본적인 준비 단계는 완료 되었습니다.
다양한 출력방식중에서 하나를 고르실때는 상단 메뉴바에서 Build 를 클릭후에
나오는 것들 중에 하나를 고르시면 됩니다. 그중 JRViewer는 기본적으로 제공되는
preview로 jasper파일 이외에 실행 파일은 남기지 않습니다.
다른 preview선택시 예를들어 PDF preview를 선택하셨다면 실행후 아까 설정하신
저장 폴더에 PDF파일이 저장이 됩니다.
다음장부터는 iReport 화면에 대해 알아보겠습니다.
53.jasper&ireport2012. 1. 3. 13:32
반응형
출처 : http://dalyal.tistory.com/entry/OpenSource-Report-작성tool-인-iReport

회사에서 진행하는 프로젝트에 사용하게 된 리포트툴입니다.
깔끔한 UI와 오픈소스로 무료배포인게 가장 큰 매력이었구요..
국내에 제대로 된 자료를 찾기 어려워서(버전이 낮은 것은 있더군요.)
직접 익힌 iReport 사용법을 소개하고자 합니다.
사용한 버전이 1.3.1 이지만 최근에 릴리즈된 2.0.1버전이랑 별 차이가 없어서
사용했던 버전에 2.0.1버전에 추가한 내용을 합해서 설명하겠습니다.
iReport 를 사용하기 위해서는 Sun Java 2 SDK 1.5 이상의 버전과
Runtime Environment (JRE) 필요하고 jasper 파일을 컴파일 하기 위해서는
Java 2(JDK)가 필요합니다.
우선은 아래 링크를 따라가서 iReport를 다운 받습니다.
http://sourceforge.net/projects/ireport/
2007년9월12일 현재 가장 최근에 릴리즈된 버전이 2.0.1버전 이네요
파일명 : iReport-2.0.1.tar.gz
적당한 위치에 다운 받으시면 됩니다.(전 그냥 바탕화면에 다운 받았습니다)
1.3 대 버전때는 인스톨을 해야 했는데
2.0 대 버전으로 넘어오면서는 인스톨 하지않고 실행이 되더군요.
자 여기까지 제대로 하셨다면 iReport 로딩 화면(분홍색꽃무늬) 보실수 있을겁니다.
